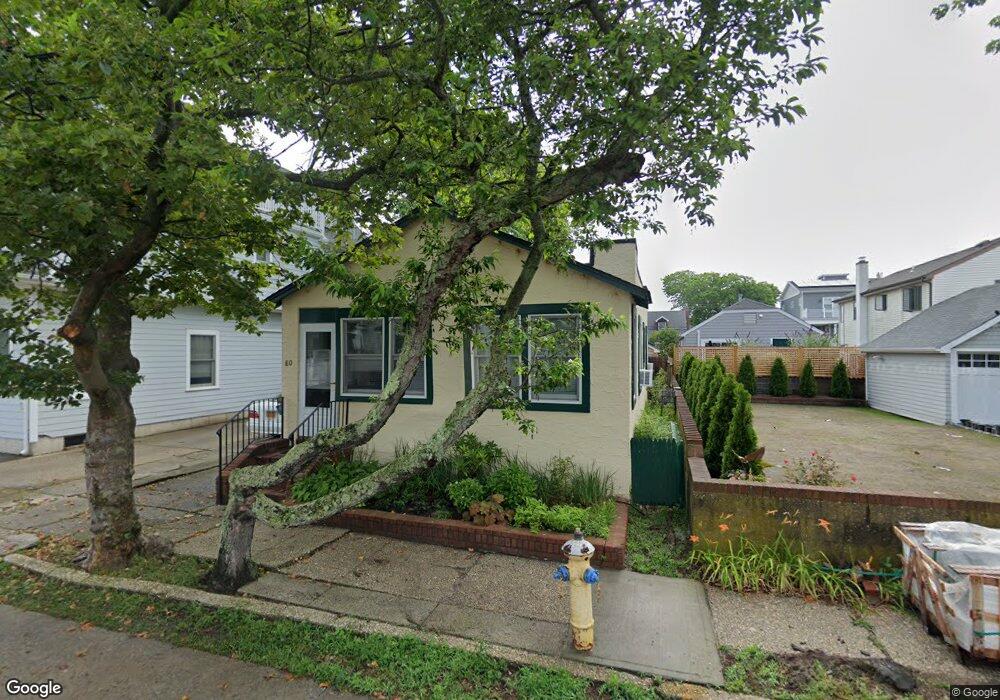
80 Cedarhurst Ave Point Lookout, NY 11569
Estimated Value: $653,799 - $1,086,000
3
Beds
1
Bath
1,000
Sq Ft
$870/Sq Ft
Est. Value
About This Home
**NO BROKER FEE ** We Have many 2, 3 and 4 Bedrooms Furnished Seasonal Beach Homes, 45 Minutes To N Y C in Point Lookout and the Lido Beach & Long Beach Area * Starting September/October 2022 through until May/June 2023, Starting @ $2,200 monthly. *Ocean Front, Jones Inlet Waterfront, Beach Houses in Town of Point Lookout Area SEE VIDEOS @ Hug Real Estate *We only show Mint Clean Beach Home Rentals, furnished off Season House Rentals with *NO BROKER'S FEE* *Call TOM FOR PRIVATE BEACH HOME RENTALS NOT LISTED HERE *NO BROKER FEE for Seasonal Furnished Rentals.
Ownership History
Date
Name
Owned For
Owner Type
Purchase Details
Closed on
Jul 11, 2019
Sold by
Molanphy John Anthony and Molanphy Patricia Nilson
Bought by
Molanphy Nelson Trust
Current Estimated Value
Purchase Details
Closed on
Dec 30, 1999
Sold by
Simmons Glen and Guy Leslie
Bought by
Molanphy John Anthony and Molanphy Patricia Nilson
Home Financials for this Owner
Home Financials are based on the most recent Mortgage that was taken out on this home.
Original Mortgage
$200,000
Interest Rate
7.48%
Mortgage Type
Purchase Money Mortgage
Purchase Details
Closed on
Apr 11, 1996
Sold by
Edmonds Peter
Bought by
Guy Leslie and Simmons Glenn
Create a Home Valuation Report for This Property
The Home Valuation Report is an in-depth analysis detailing your home's value as well as a comparison with similar homes in the area
Home Values in the Area
Average Home Value in this Area
Purchase History
| Date | Buyer | Sale Price | Title Company |
|---|---|---|---|
| Molanphy Nelson Trust | -- | None Available | |
| Molanphy John Anthony | $250,000 | First American Title Ins Co | |
| Guy Leslie | $105,000 | -- |
Source: Public Records
Mortgage History
| Date | Status | Borrower | Loan Amount |
|---|---|---|---|
| Previous Owner | Molanphy John Anthony | $200,000 |
Source: Public Records
Property History
| Date | Event | Price | List to Sale | Price per Sq Ft |
|---|---|---|---|---|
| 09/07/2022 09/07/22 | For Rent | $2,500 | -- | -- |
Tax History Compared to Growth
Tax History
| Year | Tax Paid | Tax Assessment Tax Assessment Total Assessment is a certain percentage of the fair market value that is determined by local assessors to be the total taxable value of land and additions on the property. | Land | Improvement |
|---|---|---|---|---|
| 2025 | $9,094 | $463 | $215 | $248 |
| 2024 | $2,751 | $468 | $218 | $250 |
| 2023 | $7,721 | $488 | $227 | $261 |
| 2022 | $7,721 | $488 | $227 | $261 |
| 2021 | $9,298 | $526 | $245 | $281 |
| 2020 | $7,280 | $525 | $524 | $1 |
| 2019 | $2,382 | $563 | $562 | $1 |
| 2018 | $4,225 | $600 | $0 | $0 |
| 2017 | $4,245 | $638 | $637 | $1 |
| 2016 | $6,743 | $675 | $674 | $1 |
| 2015 | $2,508 | $713 | $713 | $0 |
| 2014 | $2,508 | $713 | $713 | $0 |
| 2013 | $2,539 | $750 | $750 | $0 |
Source: Public Records
Map
Nearby Homes
- 60 Baldwin Ave
- 68 Parkside Dr
- 118 Glenwood Ave
- 23 Garden City Ave
- 44 Bayside Dr
- 30 Donna Ln
- 750 Lido Blvd Unit 86B
- 750 Lido Blvd Unit 77B
- 750 Lido Blvd Unit 43B
- 750 Lido Blvd Unit 94B
- 750 Lido Blvd Unit 55A
- 750 Lido Blvd Unit 9A
- 657 Lido Blvd
- 507 Lido Blvd
- 36 Prescott St
- 5 Kensington St
- 1 Saratoga St
- 2 Leamington St
- 3600 Bertha Dr
- 3516 Bertha Dr
- 78 Cedarhurst Ave
- 84 Cedarhurst Ave
- 81 Freeport Ave
- 83 Freeport Ave
- 79 Freeport Ave
- 81 Cedarhurst Ave
- 79 Cedarhurst Ave
- 83 Cedarhurst Ave
- 85 Freeport Ave
- 86 Cedarhurst Ave
- 75 Freeport Ave
- 75 Freeport Ave
- 74 Cedarhurst Ave
- 87 Cedarhurst Ave
- 73 Cedarhurst Ave
- 89 Freeport Ave
- 78 Bellmore Ave
- 80 Bellmore Ave
- 82 Bellmore Ave
- 90 Cedarhurst Ave