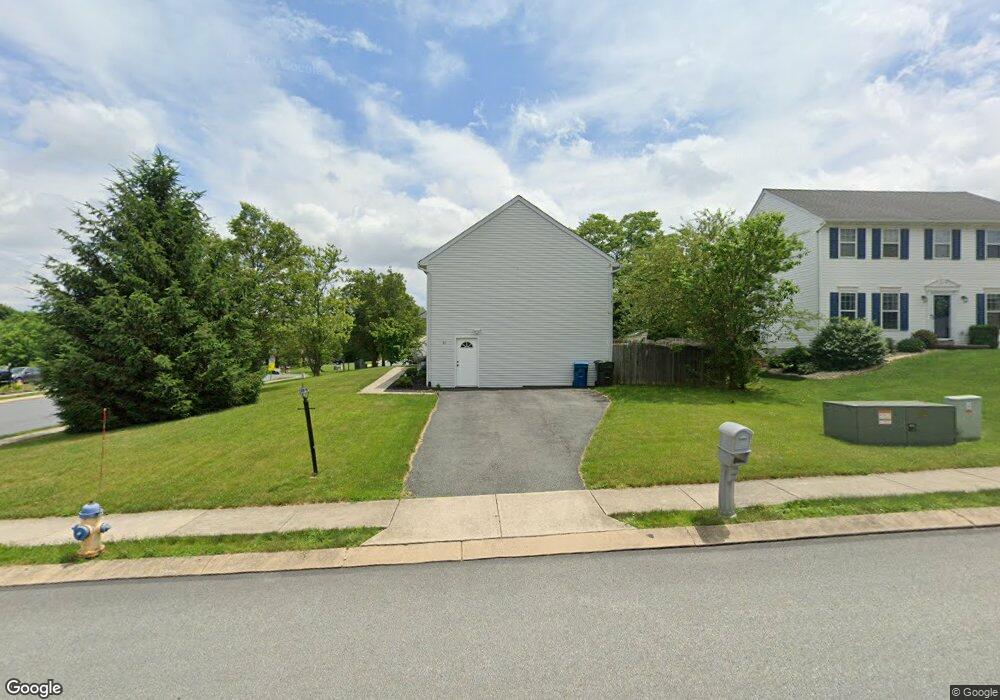
80 Chatham Ln Red Lion, PA 17356
Estimated Value: $272,000 - $308,000
3
Beds
2
Baths
1,725
Sq Ft
$168/Sq Ft
Est. Value
About This Home
This home is located at 80 Chatham Ln, Red Lion, PA 17356 and is currently estimated at $289,233, approximately $167 per square foot. 80 Chatham Ln is a home located in York County with nearby schools including Larry J. Macaluso Elementary School, Red Lion Area Junior High School, and Red Lion Area Senior High School.
Ownership History
Date
Name
Owned For
Owner Type
Purchase Details
Closed on
Mar 30, 2020
Sold by
Gurbelski Carl J and Gurbelski Margaret L
Bought by
Rudacille Mason J
Current Estimated Value
Home Financials for this Owner
Home Financials are based on the most recent Mortgage that was taken out on this home.
Original Mortgage
$183,612
Outstanding Balance
$162,964
Interest Rate
3.5%
Mortgage Type
FHA
Estimated Equity
$126,269
Purchase Details
Closed on
Nov 30, 2010
Sold by
Behlert William M and Behlert Son Ho
Bought by
Gurbelski Carl J and Gurbelski Margaret L
Purchase Details
Closed on
Jun 27, 2005
Sold by
Gibbs James S and Gibbs Dawn
Bought by
Behlert William M and Behlert Son Ho
Home Financials for this Owner
Home Financials are based on the most recent Mortgage that was taken out on this home.
Original Mortgage
$133,000
Interest Rate
5.73%
Mortgage Type
Fannie Mae Freddie Mac
Create a Home Valuation Report for This Property
The Home Valuation Report is an in-depth analysis detailing your home's value as well as a comparison with similar homes in the area
Home Values in the Area
Average Home Value in this Area
Purchase History
| Date | Buyer | Sale Price | Title Company |
|---|---|---|---|
| Rudacille Mason J | $187,000 | Homesale Settlement Services | |
| Gurbelski Carl J | $106,172 | None Available | |
| Behlert William M | $140,000 | -- |
Source: Public Records
Mortgage History
| Date | Status | Borrower | Loan Amount |
|---|---|---|---|
| Open | Rudacille Mason J | $183,612 | |
| Previous Owner | Behlert William M | $133,000 |
Source: Public Records
Tax History Compared to Growth
Tax History
| Year | Tax Paid | Tax Assessment Tax Assessment Total Assessment is a certain percentage of the fair market value that is determined by local assessors to be the total taxable value of land and additions on the property. | Land | Improvement |
|---|---|---|---|---|
| 2025 | $3,432 | $109,800 | $37,270 | $72,530 |
| 2024 | $3,297 | $109,800 | $37,270 | $72,530 |
| 2023 | $3,297 | $109,800 | $37,270 | $72,530 |
| 2022 | $3,297 | $109,800 | $37,270 | $72,530 |
| 2021 | $3,204 | $109,800 | $37,270 | $72,530 |
| 2020 | $3,204 | $109,800 | $37,270 | $72,530 |
| 2019 | $3,193 | $109,800 | $37,270 | $72,530 |
| 2018 | $3,176 | $109,800 | $37,270 | $72,530 |
| 2017 | $3,149 | $109,800 | $37,270 | $72,530 |
| 2016 | $0 | $109,800 | $37,270 | $72,530 |
| 2015 | -- | $109,800 | $37,270 | $72,530 |
| 2014 | -- | $109,800 | $37,270 | $72,530 |
Source: Public Records
Map
Nearby Homes
- 115 Ava Dr
- 2 Windsor Acres
- 2040 Windsor Rd
- 705 Danbury Dr
- 311 Boxwood Dr
- Kipling Plan at Walnut Creek
- Woodford Plan at Walnut Creek
- Harrison Plan at Walnut Creek
- Hawthorne Plan at Walnut Creek
- Savannah Plan at Walnut Creek
- Covington Plan at Walnut Creek
- Nottingham Plan at Walnut Creek
- Lachlan Plan at Walnut Creek
- Sebastian Plan at Walnut Creek
- Parker Plan at Walnut Creek
- Devonshire Plan at Walnut Creek
- Ethan Plan at Walnut Creek
- Magnolia Plan at Walnut Creek
- Andrews Plan at Walnut Creek
- Arcadia Plan at Walnut Creek
- 90 Chatham Ln
- 5 Buckingham Dr
- 20 Buckingham Dr
- 30 Buckingham Dr
- 85 Chatham Ln
- 100 Chatham Ln
- 95 Chatham Ln
- 60 Chatham Ln
- 25 Buckingham Dr
- 15 Buckingham Dr
- 65 Chatham Ln
- 105 Chatham Ln
- 110 Chatham Ln
- 15 Churchill Dr
- 40 Buckingham Dr
- 100 Wimbleton Way
- 50 Chatham Ln
- 35 Buckingham Dr
- 90 Wimbleton Way
- 25 Churchill Dr