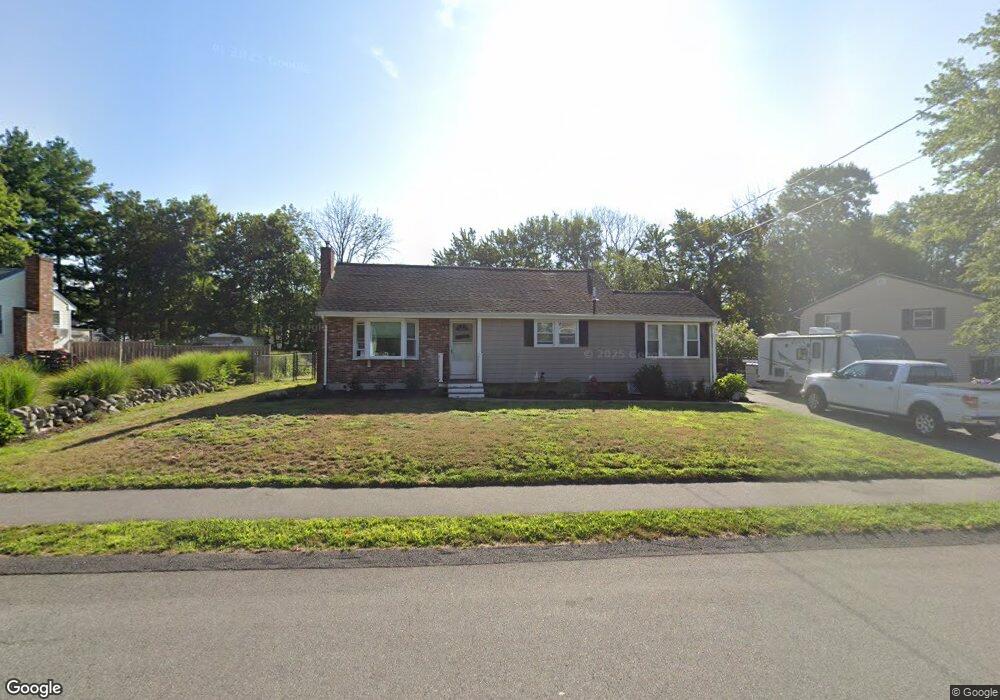
80 Darren Dr Brockton, MA 02301
Brockton Heights NeighborhoodEstimated Value: $537,327 - $563,000
3
Beds
1
Bath
1,570
Sq Ft
$348/Sq Ft
Est. Value
About This Home
This home is located at 80 Darren Dr, Brockton, MA 02301 and is currently estimated at $545,832, approximately $347 per square foot. 80 Darren Dr is a home located in Plymouth County with nearby schools including Hancock Elementary School, Manthala George Jr. School, and Louis F Angelo Elementary School.
Ownership History
Date
Name
Owned For
Owner Type
Purchase Details
Closed on
May 14, 2004
Sold by
Decoffe Michael M and Decoffe Nicole M
Bought by
Monteiro Stephen A
Current Estimated Value
Home Financials for this Owner
Home Financials are based on the most recent Mortgage that was taken out on this home.
Original Mortgage
$272,744
Outstanding Balance
$127,608
Interest Rate
5.47%
Mortgage Type
Purchase Money Mortgage
Estimated Equity
$418,224
Purchase Details
Closed on
Jul 27, 2001
Sold by
Dinopoulos Helen Est
Bought by
Decoffe Nicole M and Decoffe Michael M
Home Financials for this Owner
Home Financials are based on the most recent Mortgage that was taken out on this home.
Original Mortgage
$164,250
Interest Rate
7.18%
Mortgage Type
Purchase Money Mortgage
Create a Home Valuation Report for This Property
The Home Valuation Report is an in-depth analysis detailing your home's value as well as a comparison with similar homes in the area
Home Values in the Area
Average Home Value in this Area
Purchase History
| Date | Buyer | Sale Price | Title Company |
|---|---|---|---|
| Monteiro Stephen A | $274,900 | -- | |
| Decoffe Nicole M | $182,500 | -- |
Source: Public Records
Mortgage History
| Date | Status | Borrower | Loan Amount |
|---|---|---|---|
| Open | Decoffe Nicole M | $272,744 | |
| Previous Owner | Decoffe Nicole M | $180,000 | |
| Previous Owner | Decoffe Nicole M | $164,250 |
Source: Public Records
Tax History
| Year | Tax Paid | Tax Assessment Tax Assessment Total Assessment is a certain percentage of the fair market value that is determined by local assessors to be the total taxable value of land and additions on the property. | Land | Improvement |
|---|---|---|---|---|
| 2025 | $5,620 | $464,100 | $149,000 | $315,100 |
| 2024 | $5,302 | $441,100 | $149,000 | $292,100 |
| 2023 | $5,256 | $404,900 | $114,200 | $290,700 |
| 2022 | $4,719 | $337,800 | $104,000 | $233,800 |
| 2021 | $4,650 | $320,700 | $97,500 | $223,200 |
| 2020 | $4,581 | $302,400 | $93,400 | $209,000 |
| 2019 | $4,003 | $257,600 | $87,500 | $170,100 |
| 2018 | $3,935 | $245,000 | $87,500 | $157,500 |
| 2017 | $3,655 | $227,000 | $87,500 | $139,500 |
| 2016 | $3,856 | $222,100 | $83,700 | $138,400 |
| 2015 | $3,743 | $206,200 | $83,700 | $122,500 |
| 2014 | $3,165 | $174,600 | $83,700 | $90,900 |
Source: Public Records
Map
Nearby Homes
- 42 Brown St
- 98 Union St
- 990 Pleasant St
- 102 Alandale Ave
- 95 Union St
- LOT 4 Winterberry Ln
- Lot 2 Winterberry Ln
- Lot 1 Winterberry Ln
- 110 Union St
- 86 Union St
- 96 Winterberry Ln
- 23 Winterberry Ln
- 197 Candy Ln
- 44 Reservoir St Unit 52
- 155 Rockland Dr
- 0 Atkinson Ave
- 73 McEachron Dr
- 20 Washington St Unit 1-8
- 23 Arborway
- 685 Oak St Unit 129
Your Personal Tour Guide
Ask me questions while you tour the home.