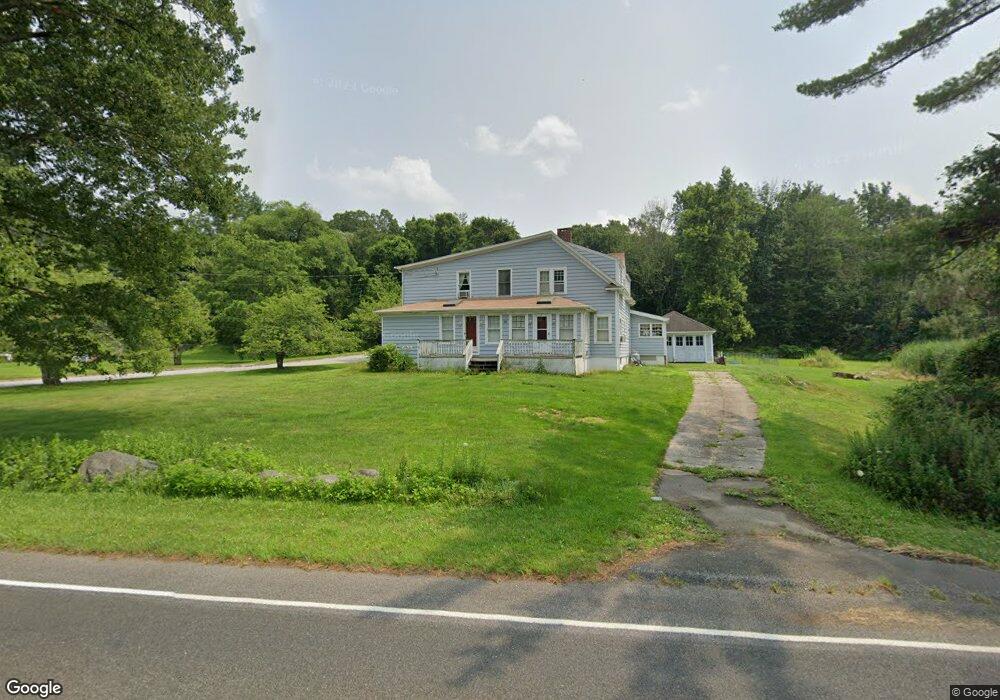
80 Dodgingtown Rd Bethel, CT 06801
Estimated Value: $474,000 - $788,447
4
Beds
5
Baths
4,352
Sq Ft
$146/Sq Ft
Est. Value
About This Home
This home is located at 80 Dodgingtown Rd, Bethel, CT 06801 and is currently estimated at $634,362, approximately $145 per square foot. 80 Dodgingtown Rd is a home located in Fairfield County with nearby schools including R.M.T. Johnson School, Bethel Middle School, and Bethel High School.
Ownership History
Date
Name
Owned For
Owner Type
Purchase Details
Closed on
Jul 23, 2009
Sold by
Deutsche Bk
Bought by
Baddowe Lara and Baddowe Majd
Current Estimated Value
Home Financials for this Owner
Home Financials are based on the most recent Mortgage that was taken out on this home.
Original Mortgage
$242,970
Interest Rate
5.58%
Purchase Details
Closed on
Jun 1, 2005
Sold by
Shaw Eric
Bought by
Contreras Jose and Piedra Maria
Home Financials for this Owner
Home Financials are based on the most recent Mortgage that was taken out on this home.
Original Mortgage
$407,200
Interest Rate
5.83%
Purchase Details
Closed on
Apr 28, 2000
Sold by
Scully Lynn A and Troischt Joanne L
Bought by
Shaw Eric
Purchase Details
Closed on
May 15, 1998
Sold by
Arborwind Lp
Bought by
Scully Lynn A and Troischt Joanne
Purchase Details
Closed on
Dec 1, 1988
Sold by
Gelia Enrico G
Bought by
Debek Allan C
Create a Home Valuation Report for This Property
The Home Valuation Report is an in-depth analysis detailing your home's value as well as a comparison with similar homes in the area
Home Values in the Area
Average Home Value in this Area
Purchase History
| Date | Buyer | Sale Price | Title Company |
|---|---|---|---|
| Baddowe Lara | $270,000 | -- | |
| Contreras Jose | $509,000 | -- | |
| Shaw Eric | $289,900 | -- | |
| Scully Lynn A | $185,500 | -- | |
| Debek Allan C | $238,000 | -- |
Source: Public Records
Mortgage History
| Date | Status | Borrower | Loan Amount |
|---|---|---|---|
| Closed | Debek Allan C | $242,970 | |
| Previous Owner | Debek Allan C | $407,200 | |
| Previous Owner | Debek Allan C | $101,800 |
Source: Public Records
Tax History
| Year | Tax Paid | Tax Assessment Tax Assessment Total Assessment is a certain percentage of the fair market value that is determined by local assessors to be the total taxable value of land and additions on the property. | Land | Improvement |
|---|---|---|---|---|
| 2025 | $12,817 | $421,470 | $95,900 | $325,570 |
| 2024 | $12,294 | $421,470 | $95,900 | $325,570 |
| 2023 | $11,982 | $421,470 | $95,900 | $325,570 |
| 2022 | $9,729 | $281,260 | $95,900 | $185,360 |
| 2021 | $9,636 | $281,260 | $95,900 | $185,360 |
| 2020 | $9,490 | $281,260 | $95,900 | $185,360 |
| 2019 | $9,397 | $281,260 | $95,900 | $185,360 |
| 2018 | $9,245 | $281,260 | $95,900 | $185,360 |
| 2017 | $9,555 | $290,610 | $95,870 | $194,740 |
| 2016 | $9,349 | $290,610 | $95,870 | $194,740 |
| 2015 | $9,352 | $290,610 | $95,870 | $194,740 |
| 2014 | $9,331 | $290,610 | $95,870 | $194,740 |
Source: Public Records
Map
Nearby Homes
- 62 Linda Ln
- 62 Codfish Hill Rd
- 109 Codfish Hill Rd
- 36 Shelley Rd
- 73 Dodgingtown Rd
- 9 Katrina Cir
- 72 Old Hawleyville Rd
- 6 Katrina Cir
- 2 Judd Ave
- 30 Highland Ave
- 24 Pleasant Hill Rd
- 19 Brookwood Dr
- 14 Winthrop Rd
- 23 Walnut Hill Rd
- 28 Greenwood Ave
- 16 Cemetery Rd
- 4 Stone Dam Rd
- 62 Walnut Hill Rd
- 5 Deer Run
- 32 Deer Run
- 84 Dodgingtown Rd
- 78 Dodgingtown Rd
- 3 Settlers Rd
- 74 Dodgingtown Rd
- 4 Settlers Rd
- 87 Dodgingtown Rd
- 1 Settlers Rd
- 5 Settlers Rd
- 26 Kellogg St
- 89 Dodgingtown Rd
- 85 Dodgingtown Rd
- 85 Dodgingtown Rd
- 6 Settlers Rd
- 72 Dodgingtown Rd
- 7 Settlers Rd
- Lot # 2 Rockwell Rd
- 70 Dodgingtown Rd
- 91 Dodgingtown Rd
- 24 Kellogg St
- 20 Kellogg St
Your Personal Tour Guide
Ask me questions while you tour the home.