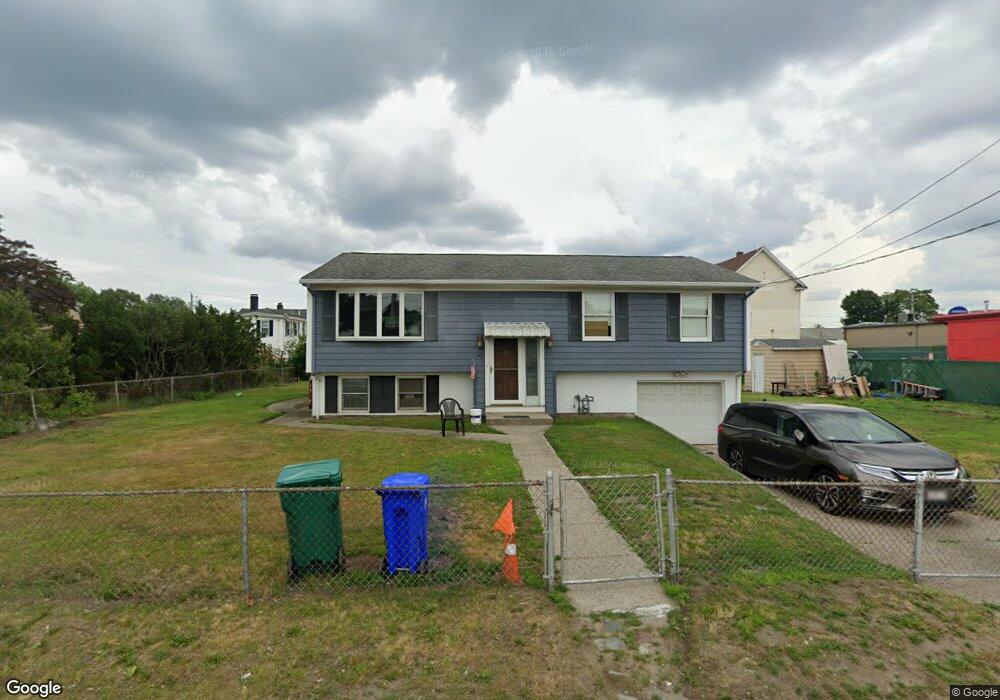
80 E Bacon St Attleboro, MA 02703
Estimated Value: $439,000 - $526,000
3
Beds
1
Bath
2,256
Sq Ft
$207/Sq Ft
Est. Value
About This Home
This home is located at 80 E Bacon St, Attleboro, MA 02703 and is currently estimated at $465,872, approximately $206 per square foot. 80 E Bacon St is a home located in Bristol County with nearby schools including Hill-Roberts Elementary School, Robert J. Coelho Middle School, and Attleboro High School.
Ownership History
Date
Name
Owned For
Owner Type
Purchase Details
Closed on
Dec 28, 2021
Sold by
L J Stasiukiewicz Ret
Bought by
Patel Ashokkumar
Current Estimated Value
Purchase Details
Closed on
Nov 15, 2012
Sold by
Stasiukiewicz Leonard J and Stasiukiewicz Della L
Bought by
L J Stasiukiewicz Ret
Purchase Details
Closed on
Jan 1, 1962
Bought by
L J Stasiukiewicz Ret
Create a Home Valuation Report for This Property
The Home Valuation Report is an in-depth analysis detailing your home's value as well as a comparison with similar homes in the area
Home Values in the Area
Average Home Value in this Area
Purchase History
| Date | Buyer | Sale Price | Title Company |
|---|---|---|---|
| Patel Ashokkumar | $350,000 | None Available | |
| L J Stasiukiewicz Ret | -- | -- | |
| L J Stasiukiewicz Ret | -- | -- |
Source: Public Records
Tax History Compared to Growth
Tax History
| Year | Tax Paid | Tax Assessment Tax Assessment Total Assessment is a certain percentage of the fair market value that is determined by local assessors to be the total taxable value of land and additions on the property. | Land | Improvement |
|---|---|---|---|---|
| 2025 | $4,248 | $338,500 | $129,500 | $209,000 |
| 2024 | $4,247 | $333,600 | $129,500 | $204,100 |
| 2023 | $4,011 | $293,000 | $117,700 | $175,300 |
| 2022 | $3,822 | $264,500 | $112,100 | $152,400 |
| 2021 | $3,573 | $241,400 | $107,800 | $133,600 |
| 2020 | $3,382 | $232,300 | $104,700 | $127,600 |
| 2019 | $3,202 | $226,100 | $102,700 | $123,400 |
| 2018 | $3,083 | $208,000 | $99,700 | $108,300 |
| 2017 | $3,037 | $208,700 | $99,700 | $109,000 |
| 2016 | $2,894 | $195,300 | $97,900 | $97,400 |
| 2015 | $2,863 | $194,600 | $97,900 | $96,700 |
| 2014 | $2,741 | $184,600 | $93,200 | $91,400 |
Source: Public Records
Map
Nearby Homes
- 79 Turner St
- 37 Turner St
- 61 Mendon Rd
- 735 Broadway
- 27 Collins Ave
- 91 Greenwich St
- 23 Colvin St
- 39 John St
- 18 Newton St
- 179 Columbine Ave
- 50 Pullman Ave Unit A
- 50 Pullman Ave Unit B
- 171 Mendon Rd
- 58 Baltic St Unit 58
- 56 Baltic St Unit 56
- 54 Baltic St Unit 54
- 52 Baltic St Unit 52
- 39 Webster St Unit 204
- 207 Benefit St
- 11 Appleton Ave
- 76 Bacon St
- 1094 Washington St
- 1078 Washington St
- 89 Turner St
- 77 E Bacon St
- 1074 Washington St
- 97 Turner St
- 77 Turner St
- 73 E Bacon St
- 70 E Bacon St
- 1124 Washington St
- 92 Turner St Unit 92
- 90 Turner St Unit 92
- 69 E Bacon St
- 75 Turner St
- 66 E Bacon St
- 64 Turner St
- 73 Turner St
- 73 Turner St
- 80 Turner St