Estimated Value: $400,000 - $462,379
5
Beds
5
Baths
7,252
Sq Ft
$59/Sq Ft
Est. Value
About This Home
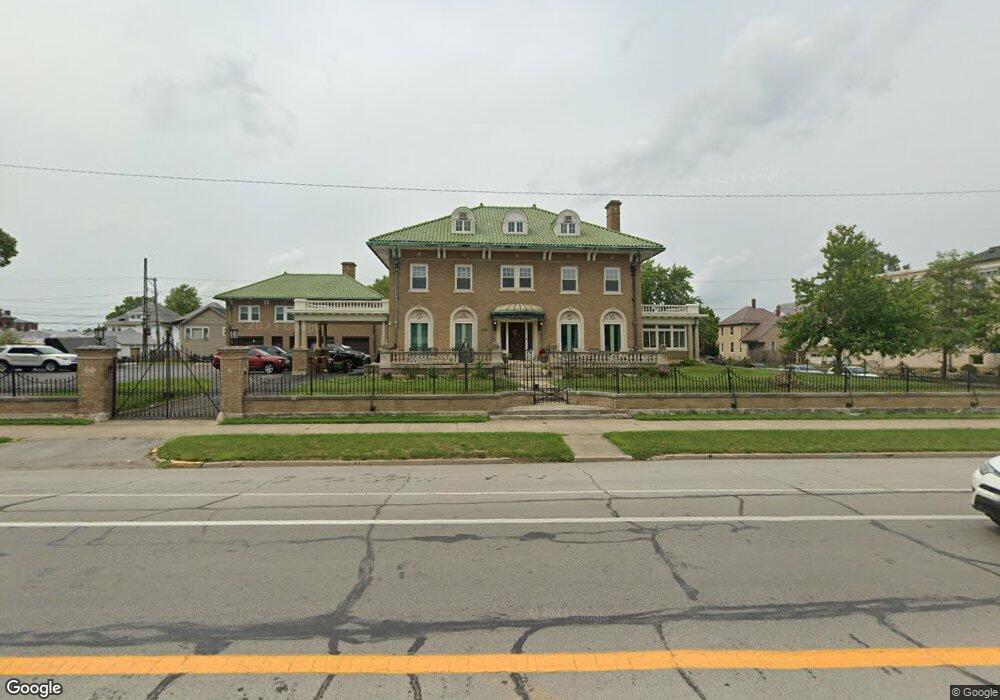
This home is located at 80 E Main St, Peru, IN 46970 and is currently estimated at $431,190, approximately $59 per square foot. 80 E Main St is a home located in Miami County with nearby schools including Elmwood Primary Learning Center, Blair Pointe Upper Elementary School, and Peru Junior/High School.
Ownership History
Date
Name
Owned For
Owner Type
Purchase Details
Closed on
Oct 14, 2021
Sold by
Woodhams Dorothy M and Woodhams Walter A
Bought by
Day Richard H and Day Mary E
Current Estimated Value
Home Financials for this Owner
Home Financials are based on the most recent Mortgage that was taken out on this home.
Original Mortgage
$2,000,000
Outstanding Balance
$450,321
Interest Rate
2.8%
Mortgage Type
New Conventional
Estimated Equity
-$19,131
Purchase Details
Closed on
Jan 17, 2019
Sold by
Woodhams Walter B and Woodhams Dorothy M
Bought by
Woodhams Walter B and Woodhams Dorothy M
Purchase Details
Closed on
Jun 23, 2005
Sold by
Woodhams Walter A
Bought by
Woodhams Walter B and Woodhams Dorothy M
Create a Home Valuation Report for This Property
The Home Valuation Report is an in-depth analysis detailing your home's value as well as a comparison with similar homes in the area
Home Values in the Area
Average Home Value in this Area
Purchase History
| Date | Buyer | Sale Price | Title Company |
|---|---|---|---|
| Day Richard H | -- | None Listed On Document | |
| Woodhams Walter B | -- | None Available | |
| Woodhams Walter B | -- | None Available |
Source: Public Records
Mortgage History
| Date | Status | Borrower | Loan Amount |
|---|---|---|---|
| Open | Day Richard H | $2,000,000 |
Source: Public Records
Tax History
| Year | Tax Paid | Tax Assessment Tax Assessment Total Assessment is a certain percentage of the fair market value that is determined by local assessors to be the total taxable value of land and additions on the property. | Land | Improvement |
|---|---|---|---|---|
| 2025 | $4,648 | $509,300 | $24,400 | $484,900 |
| 2024 | $4,648 | $439,400 | $24,400 | $415,000 |
| 2023 | $4,648 | $435,600 | $24,400 | $411,200 |
| 2022 | $6,085 | $350,300 | $24,400 | $325,900 |
| 2021 | $3,820 | $232,500 | $8,100 | $224,400 |
| 2020 | $3,768 | $232,500 | $8,100 | $224,400 |
| 2019 | $3,105 | $193,200 | $8,100 | $185,100 |
| 2018 | $2,572 | $163,300 | $8,100 | $155,200 |
| 2017 | $2,516 | $161,600 | $8,100 | $153,500 |
| 2016 | $2,514 | $161,600 | $8,100 | $153,500 |
| 2014 | $2,409 | $160,900 | $8,100 | $152,800 |
| 2013 | -- | $161,000 | $8,100 | $152,900 |
Source: Public Records
Map
Nearby Homes
- 103 E 2nd St
- 115 N Miami St
- 69 W 5th St
- 222 E 5th St
- 68 W 7th St
- 103 E Riverside Dr
- 110 W 6th St
- 269 E 5th St
- 25 E Franklin St
- 62 S Wayne St
- 352 N Broadway
- 320 E Main St
- 14 Barkley Dr
- 329 E 2nd St
- 353 E 6th St
- 236 W 6th St
- Corner of W Kim Road and West Lakeview Dr
- Lot 1 W Kim Rd and N Striker Rd
- Lot 9 N Striker Rd and W Lakeview Dr
- 12 & 12 1/2 N Lafayette St
Your Personal Tour Guide
Ask me questions while you tour the home.