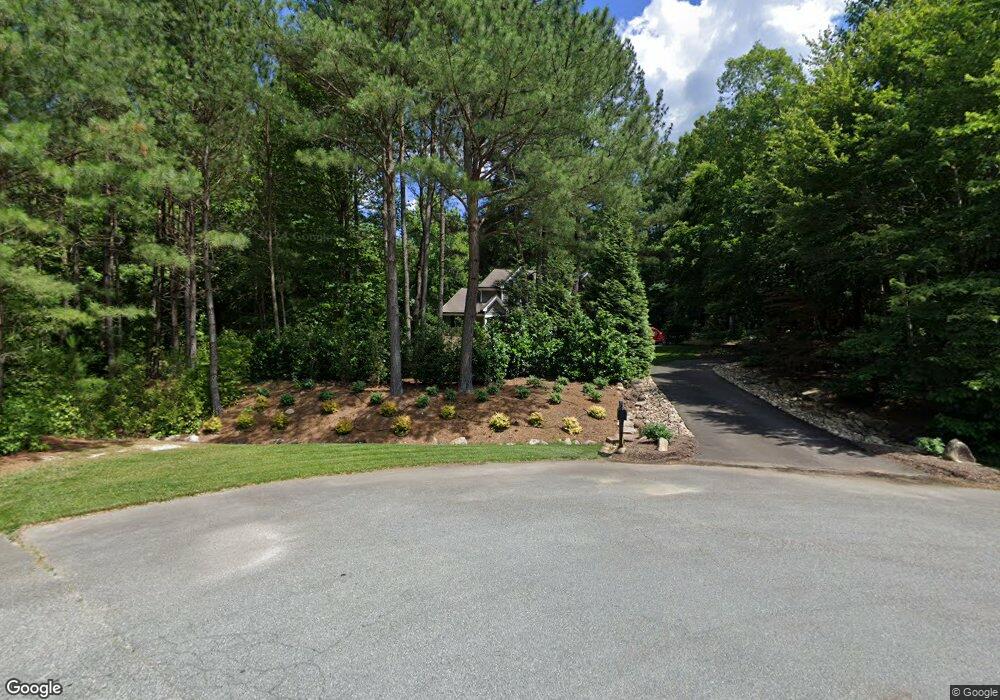
80 Emerald Crest Point Chapel Hill, NC 27516
Estimated Value: $890,765 - $1,108,000
4
Beds
4
Baths
3,257
Sq Ft
$311/Sq Ft
Est. Value
About This Home
This home is located at 80 Emerald Crest Point, Chapel Hill, NC 27516 and is currently estimated at $1,012,941, approximately $311 per square foot. 80 Emerald Crest Point is a home located in Chatham County with nearby schools including Margaret B. Pollard Middle School, Northwood High, and Holy Youth Christian Academy.
Ownership History
Date
Name
Owned For
Owner Type
Purchase Details
Closed on
Apr 25, 2017
Sold by
Schiavone Elizabeth and Schiavon John
Bought by
Brazille Arthur W and Brazille Kimberly A
Current Estimated Value
Home Financials for this Owner
Home Financials are based on the most recent Mortgage that was taken out on this home.
Original Mortgage
$503,100
Outstanding Balance
$418,696
Interest Rate
4.3%
Mortgage Type
New Conventional
Estimated Equity
$594,245
Purchase Details
Closed on
Jun 28, 2013
Sold by
Baker Jerom F and Baker Kathy E
Bought by
Schiavone Elizabeth
Purchase Details
Closed on
May 20, 2008
Sold by
The Cottages At Stonegate Llc
Bought by
Baker Jerome F and Baker Kathy E
Home Financials for this Owner
Home Financials are based on the most recent Mortgage that was taken out on this home.
Original Mortgage
$480,000
Interest Rate
6%
Mortgage Type
Construction
Create a Home Valuation Report for This Property
The Home Valuation Report is an in-depth analysis detailing your home's value as well as a comparison with similar homes in the area
Home Values in the Area
Average Home Value in this Area
Purchase History
| Date | Buyer | Sale Price | Title Company |
|---|---|---|---|
| Brazille Arthur W | $559,000 | None Available | |
| Schiavone Elizabeth | $525,000 | None Available | |
| Baker Jerome F | $135,000 | None Available |
Source: Public Records
Mortgage History
| Date | Status | Borrower | Loan Amount |
|---|---|---|---|
| Open | Brazille Arthur W | $503,100 | |
| Previous Owner | Baker Jerome F | $480,000 |
Source: Public Records
Tax History
| Year | Tax Paid | Tax Assessment Tax Assessment Total Assessment is a certain percentage of the fair market value that is determined by local assessors to be the total taxable value of land and additions on the property. | Land | Improvement |
|---|---|---|---|---|
| 2025 | $5,330 | $736,926 | $171,000 | $565,926 |
| 2024 | $5,330 | $519,827 | $157,840 | $361,987 |
| 2023 | $4,571 | $519,827 | $157,840 | $361,987 |
| 2022 | $4,195 | $519,827 | $157,840 | $361,987 |
| 2021 | $4,143 | $519,827 | $157,840 | $361,987 |
| 2020 | $4,112 | $512,412 | $128,350 | $384,062 |
| 2019 | $4,112 | $512,412 | $128,350 | $384,062 |
| 2018 | $3,837 | $512,412 | $128,350 | $384,062 |
| 2017 | $3,837 | $512,412 | $128,350 | $384,062 |
| 2016 | $4,076 | $540,823 | $128,350 | $412,473 |
| 2015 | $4,011 | $540,823 | $128,350 | $412,473 |
| 2014 | $680 | $540,823 | $128,350 | $412,473 |
| 2013 | -- | $540,823 | $128,350 | $412,473 |
Source: Public Records
Map
Nearby Homes
- 2939 Lamont Norwood Rd
- 110 Wolfs Trail
- 67 Gracehope Ln
- 68 Willow Way
- 136 Loblolly Ln
- 33 Henry Ct
- 3701 Stonegate Dr
- 93 Kenwood Ln
- 3502 Stonegate Dr
- 269 Ivy Ridge Rd
- 560 Great Ridge Pkwy
- 250 Ivy Ridge Rd
- 296 Ivy Ridge Rd
- 614 Great Ridge Pkwy
- 247 Ivy Ridge Rd
- 272 Ivy Ridge Rd
- 17 Monteith Dr
- 105 Trailwood Ct
- 646 Great Ridge Pkwy
- 213 Ivy Ridge Rd
- 80 Emerald Crest Ct
- 16 Emerald Crest Point
- 16 Emerald Crest Ct
- 83 Emerald Crest Point
- 83 Emerald Crest Point Unit 12
- 128 Gilmore Rd
- 128 Gilmore Rd Unit 8
- 41 Emerald Crest Point
- 41 Emerald Crest Point Unit Lt 13
- 807 Poythress Rd
- 715 Poythress Rd
- 773 Poythress Rd
- 26 Cannamann Rd
- 26 Cannamann Rd Unit 9
- 90 Gilmore Rd
- 90 Gilmore Rd Unit 7
- 18 White Pine Way
- 851 Poythress Rd
- 65 Cannamann Rd
- 887 Poythress Rd
Your Personal Tour Guide
Ask me questions while you tour the home.