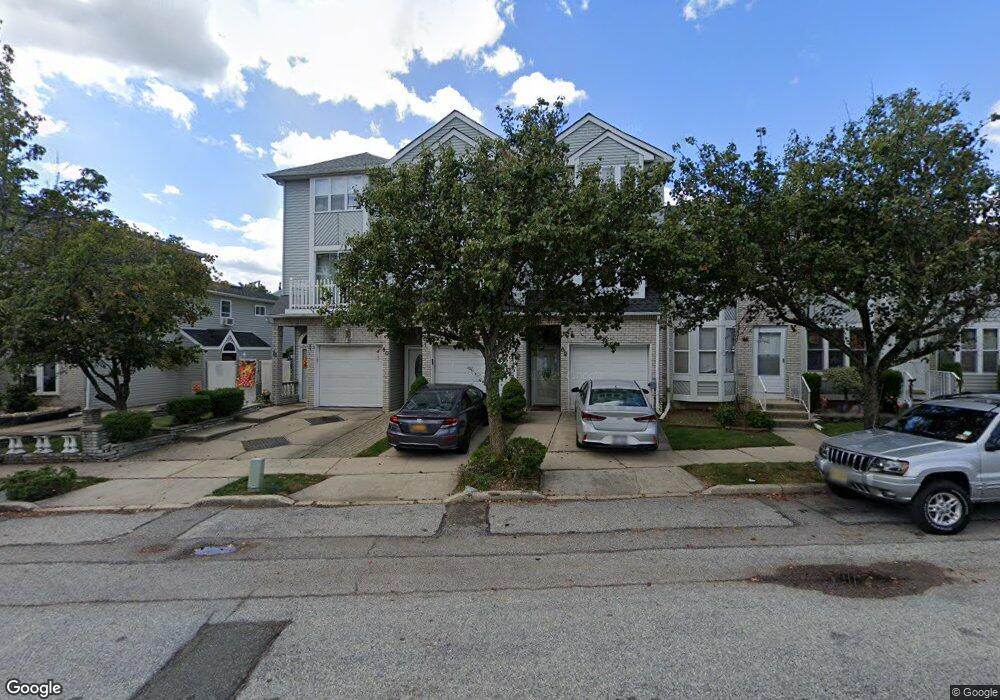
80 Everton Ave Staten Island, NY 10312
Huguenot NeighborhoodEstimated Value: $585,208 - $631,000
2
Beds
2
Baths
1,368
Sq Ft
$445/Sq Ft
Est. Value
About This Home
This home is located at 80 Everton Ave, Staten Island, NY 10312 and is currently estimated at $608,302, approximately $444 per square foot. 80 Everton Ave is a home located in Richmond County with nearby schools including P.S. 4 - Maurice Wollin, I.S. 075 Frank D. Paulo, and Tottenville High School.
Ownership History
Date
Name
Owned For
Owner Type
Purchase Details
Closed on
Mar 22, 2021
Sold by
Yeum Kyung E
Bought by
Yeum Kyung E and Kyung Yeum Trust
Current Estimated Value
Purchase Details
Closed on
Jun 28, 2010
Sold by
Maglathlin David I and Maglathlin Mary Ellen
Bought by
Yeum Kyung E
Home Financials for this Owner
Home Financials are based on the most recent Mortgage that was taken out on this home.
Original Mortgage
$272,000
Outstanding Balance
$181,289
Interest Rate
4.78%
Mortgage Type
New Conventional
Estimated Equity
$427,013
Purchase Details
Closed on
Nov 15, 2005
Sold by
Blanco Evelyn and Blanco Jose
Bought by
Maglathlin David I and Maglathlin Mary Ellen
Home Financials for this Owner
Home Financials are based on the most recent Mortgage that was taken out on this home.
Original Mortgage
$357,500
Interest Rate
6.28%
Mortgage Type
VA
Purchase Details
Closed on
Aug 18, 1995
Sold by
Orrei Vincent and Orrei Catherine L
Bought by
Blanco Jose L and Blanco Evelyn
Create a Home Valuation Report for This Property
The Home Valuation Report is an in-depth analysis detailing your home's value as well as a comparison with similar homes in the area
Home Values in the Area
Average Home Value in this Area
Purchase History
| Date | Buyer | Sale Price | Title Company |
|---|---|---|---|
| Yeum Kyung E | -- | None Available | |
| Yeum Kyung E | $340,000 | The Judicial Title Insurance | |
| Maglathlin David I | $360,000 | Commonwealth Land Title Insu | |
| Blanco Jose L | $146,000 | Chicago Title Insurance Co |
Source: Public Records
Mortgage History
| Date | Status | Borrower | Loan Amount |
|---|---|---|---|
| Open | Yeum Kyung E | $272,000 | |
| Previous Owner | Maglathlin David I | $357,500 |
Source: Public Records
Tax History Compared to Growth
Tax History
| Year | Tax Paid | Tax Assessment Tax Assessment Total Assessment is a certain percentage of the fair market value that is determined by local assessors to be the total taxable value of land and additions on the property. | Land | Improvement |
|---|---|---|---|---|
| 2025 | $5,397 | $34,140 | $3,790 | $30,350 |
| 2024 | $5,397 | $28,560 | $4,516 | $24,044 |
| 2023 | $5,409 | $26,635 | $4,402 | $22,233 |
| 2022 | $5,016 | $27,660 | $4,800 | $22,860 |
| 2021 | $5,011 | $29,220 | $4,800 | $24,420 |
| 2020 | $4,755 | $28,020 | $4,800 | $23,220 |
| 2019 | $4,685 | $27,600 | $4,800 | $22,800 |
| 2018 | $4,525 | $22,196 | $4,565 | $17,631 |
| 2017 | $4,269 | $20,940 | $4,800 | $16,140 |
| 2016 | $3,967 | $19,843 | $4,796 | $15,047 |
| 2015 | $3,581 | $18,720 | $4,800 | $13,920 |
| 2014 | $3,581 | $18,662 | $4,580 | $14,082 |
Source: Public Records
Map
Nearby Homes
- 225 Rosedale Ave
- 9 Sperry Place
- 208 Rosedale Ave
- 12 Delmar Ave Unit A
- 43 Everton Ave
- 42 Everton Ave
- 22 Belfield Ave
- 101 Stack Dr Unit A
- 117 Boulder St
- 32 Ebey Ln
- 875 Woodrow Rd
- 16 Ebey Ln
- 33 Ebey Ln
- 798 Woodrow Rd
- 123 Cardiff St
- 97 Cardiff St
- 318 Green Valley Rd
- 177 Russek Dr Unit 1
- 177 Russek Dr Unit 7
- 135 Russek Dr Unit 43
- 82 Everton Ave
- 78 Everton Ave
- 84 Everton Ave
- 84 Everton Ave
- 84 Everton Ave
- 84 Everton Ave
- 86 Everton Ave
- 231 Rosedale Ave
- 74 Everton Ave
- 88 Everton Ave
- 229 Rosedale Ave
- 72 Everton Ave
- 227 Rosedale Ave
- 70 Everton Ave
- 68 Everton Ave
- 223 Rosedale Ave
- 66 Everton Ave
- 221 Rosedale Ave
- 219 Rosedale Ave
- 64 Everton Ave