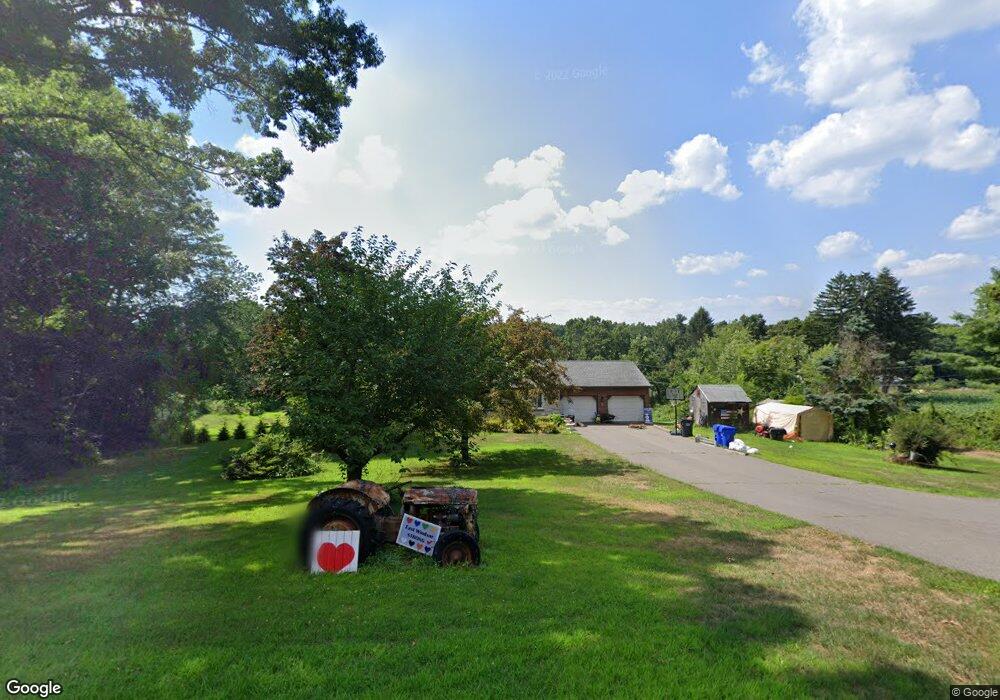
80 Graham Rd Broad Brook, CT 06016
Estimated Value: $413,000 - $555,000
5
Beds
2
Baths
1,473
Sq Ft
$313/Sq Ft
Est. Value
About This Home
This home is located at 80 Graham Rd, Broad Brook, CT 06016 and is currently estimated at $461,242, approximately $313 per square foot. 80 Graham Rd is a home located in Hartford County with nearby schools including Broad Brook Elementary School, East Windsor Middle School, and East Windsor High School.
Ownership History
Date
Name
Owned For
Owner Type
Purchase Details
Closed on
Dec 1, 2000
Sold by
Lenares Paul
Bought by
Prior Gregg and Prior Marisa
Current Estimated Value
Home Financials for this Owner
Home Financials are based on the most recent Mortgage that was taken out on this home.
Original Mortgage
$139,000
Interest Rate
7.76%
Create a Home Valuation Report for This Property
The Home Valuation Report is an in-depth analysis detailing your home's value as well as a comparison with similar homes in the area
Home Values in the Area
Average Home Value in this Area
Purchase History
| Date | Buyer | Sale Price | Title Company |
|---|---|---|---|
| Prior Gregg | $173,000 | -- |
Source: Public Records
Mortgage History
| Date | Status | Borrower | Loan Amount |
|---|---|---|---|
| Open | Prior Gregg | $57,000 | |
| Open | Prior Gregg | $166,000 | |
| Closed | Prior Gregg | $185,000 | |
| Closed | Prior Gregg | $139,000 |
Source: Public Records
Tax History
| Year | Tax Paid | Tax Assessment Tax Assessment Total Assessment is a certain percentage of the fair market value that is determined by local assessors to be the total taxable value of land and additions on the property. | Land | Improvement |
|---|---|---|---|---|
| 2025 | $8,548 | $322,700 | $76,730 | $245,970 |
| 2024 | $7,926 | $322,700 | $76,730 | $245,970 |
| 2023 | $6,453 | $188,240 | $54,470 | $133,770 |
| 2022 | $6,472 | $188,240 | $54,470 | $133,770 |
| 2021 | $6,494 | $188,240 | $54,470 | $133,770 |
| 2020 | $6,536 | $188,240 | $54,470 | $133,770 |
| 2019 | $6,447 | $188,240 | $54,470 | $133,770 |
| 2018 | $6,381 | $188,240 | $54,470 | $133,770 |
| 2017 | $6,049 | $184,600 | $65,010 | $119,590 |
| 2016 | $5,710 | $184,600 | $65,010 | $119,590 |
| 2015 | $5,595 | $184,600 | $65,010 | $119,590 |
| 2014 | $5,497 | $184,600 | $65,010 | $119,590 |
Source: Public Records
Map
Nearby Homes
- 814 Graham Rd
- 76 Griffin Rd
- 555 Graham Rd
- 64 Garnet Ln
- 72 Rockville Rd
- 610 Niederwerfer Rd
- 534 Rye St
- 79 Steep Rd
- 33 Ash Rd
- 0 Thrall Rd Unit 24150600
- 20 Apothecaries Hall Rd
- 0 Chamberlain Rd Unit 24154561
- 192 Scantic Meadow Rd
- 0 Ellsworth Rd
- 668 Sullivan Ave
- 3 Brookmeadow Ln
- 4 Jessie Ln
- 74 Wapping Wood Rd
- 51 Carriage Dr
- 77 Thrall Rd
Your Personal Tour Guide
Ask me questions while you tour the home.