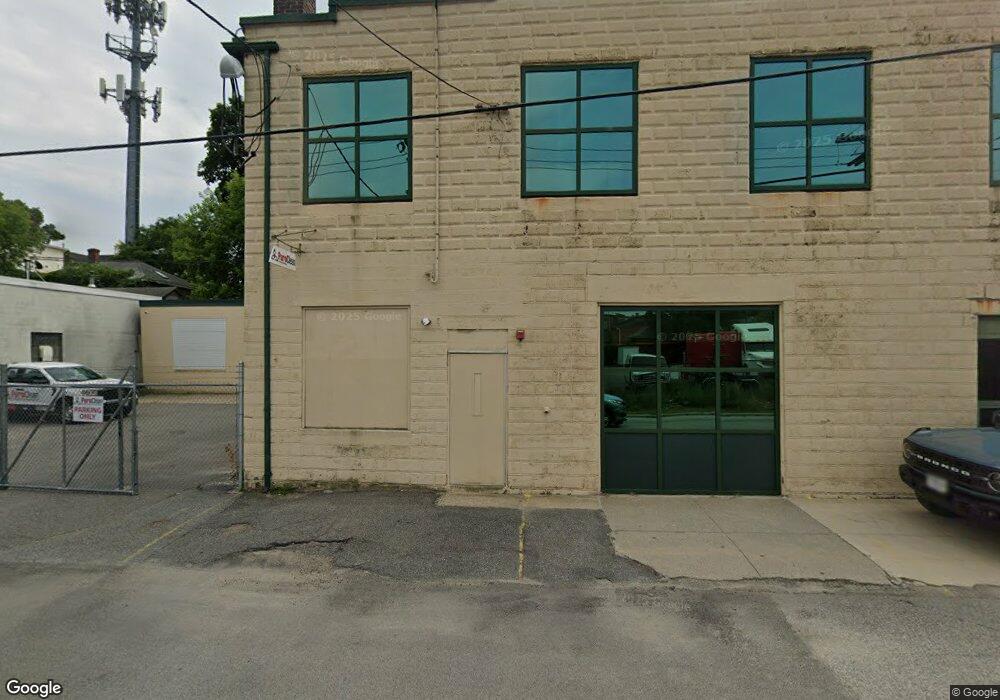
80 Hathaway St Providence, RI 02907
South Elmwood NeighborhoodEstimated Value: $862,982
--
Bed
--
Bath
9,292
Sq Ft
$93/Sq Ft
Est. Value
About This Home
This home is located at 80 Hathaway St, Providence, RI 02907 and is currently estimated at $862,982, approximately $92 per square foot. 80 Hathaway St is a home located in Providence County with nearby schools including W. R. Dutemple School, Park View Middle School, and Cranston High School East.
Ownership History
Date
Name
Owned For
Owner Type
Purchase Details
Closed on
Jul 23, 2018
Sold by
M&M Hld Co Llc
Bought by
Sanford 3Rd Step Llc
Current Estimated Value
Home Financials for this Owner
Home Financials are based on the most recent Mortgage that was taken out on this home.
Original Mortgage
$267,000
Interest Rate
4.5%
Mortgage Type
Purchase Money Mortgage
Purchase Details
Closed on
May 20, 2005
Sold by
Fielding Thomas E
Bought by
M & M Holdings Co Llc
Create a Home Valuation Report for This Property
The Home Valuation Report is an in-depth analysis detailing your home's value as well as a comparison with similar homes in the area
Home Values in the Area
Average Home Value in this Area
Purchase History
| Date | Buyer | Sale Price | Title Company |
|---|---|---|---|
| Sanford 3Rd Step Llc | $475,000 | -- | |
| M & M Holdings Co Llc | $370,000 | -- |
Source: Public Records
Mortgage History
| Date | Status | Borrower | Loan Amount |
|---|---|---|---|
| Open | M & M Holdings Co Llc | $222,000 | |
| Closed | M & M Holdings Co Llc | $267,000 | |
| Closed | M & M Holdings Co Llc | $213,600 |
Source: Public Records
Tax History Compared to Growth
Tax History
| Year | Tax Paid | Tax Assessment Tax Assessment Total Assessment is a certain percentage of the fair market value that is determined by local assessors to be the total taxable value of land and additions on the property. | Land | Improvement |
|---|---|---|---|---|
| 2025 | $11,651 | $559,600 | $56,500 | $503,100 |
| 2024 | $11,427 | $559,600 | $56,500 | $503,100 |
| 2023 | $12,443 | $438,900 | $48,600 | $390,300 |
| 2022 | $12,188 | $438,900 | $48,600 | $390,300 |
| 2021 | $11,850 | $438,900 | $48,600 | $390,300 |
| 2020 | $7,397 | $237,400 | $38,900 | $198,500 |
| 2019 | $7,397 | $237,400 | $38,900 | $198,500 |
| 2018 | $7,226 | $237,400 | $38,900 | $198,500 |
| 2017 | $7,811 | $227,000 | $46,200 | $180,800 |
| 2016 | $7,645 | $227,000 | $46,200 | $180,800 |
| 2015 | $7,645 | $227,000 | $46,200 | $180,800 |
| 2014 | $8,599 | $251,000 | $54,700 | $196,300 |
Source: Public Records
Map
Nearby Homes