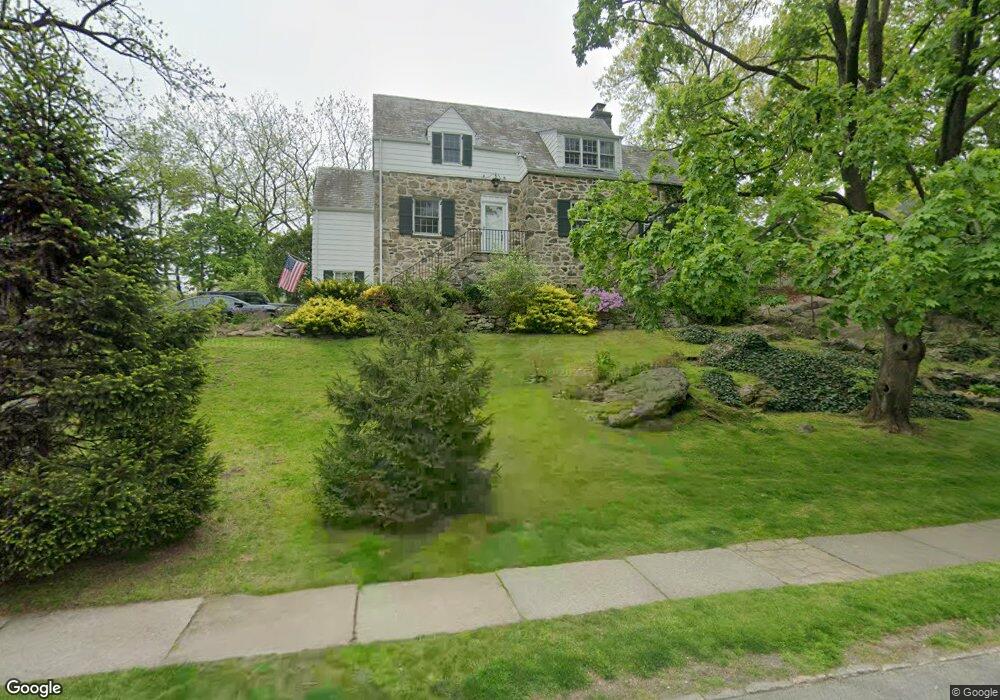
80 Howell Ave Larchmont, NY 10538
Estimated Value: $2,103,000 - $2,374,000
5
Beds
4
Baths
2,841
Sq Ft
$772/Sq Ft
Est. Value
About This Home
This home is located at 80 Howell Ave, Larchmont, NY 10538 and is currently estimated at $2,192,618, approximately $771 per square foot. 80 Howell Ave is a home located in Westchester County with nearby schools including Mamaroneck High School, Sts. John & Paul School, and Liberty Montessori School.
Ownership History
Date
Name
Owned For
Owner Type
Purchase Details
Closed on
May 5, 2023
Sold by
Stone George M
Bought by
George M Stone Living Trust and Andree S Bogaerts Living Trust
Current Estimated Value
Purchase Details
Closed on
Jul 26, 2021
Sold by
Town Of Mamaroneck
Bought by
Stone George
Purchase Details
Closed on
Jul 16, 2001
Sold by
Cozzi Louis H and Cozzi Susan Podesta
Bought by
Stone George and Bogaerts Andree S
Home Financials for this Owner
Home Financials are based on the most recent Mortgage that was taken out on this home.
Original Mortgage
$550,000
Interest Rate
7.16%
Mortgage Type
Purchase Money Mortgage
Purchase Details
Closed on
Mar 2, 1994
Sold by
Paddock Anthony C
Bought by
Cozzi Louis H and Cozzi Susan Podesta
Create a Home Valuation Report for This Property
The Home Valuation Report is an in-depth analysis detailing your home's value as well as a comparison with similar homes in the area
Home Values in the Area
Average Home Value in this Area
Purchase History
| Date | Buyer | Sale Price | Title Company |
|---|---|---|---|
| George M Stone Living Trust | -- | None Listed On Document | |
| Stone George | $10,000 | Benchmark Title | |
| Stone George | $892,500 | -- | |
| Cozzi Louis H | $395,000 | The Title Guarantee Company |
Source: Public Records
Mortgage History
| Date | Status | Borrower | Loan Amount |
|---|---|---|---|
| Previous Owner | Stone George | $550,000 |
Source: Public Records
Tax History Compared to Growth
Tax History
| Year | Tax Paid | Tax Assessment Tax Assessment Total Assessment is a certain percentage of the fair market value that is determined by local assessors to be the total taxable value of land and additions on the property. | Land | Improvement |
|---|---|---|---|---|
| 2024 | $35,563 | $1,738,000 | $410,500 | $1,327,500 |
| 2023 | $32,737 | $1,609,000 | $410,500 | $1,198,500 |
| 2022 | $31,617 | $1,490,000 | $410,500 | $1,079,500 |
| 2021 | $31,735 | $1,406,000 | $403,000 | $1,003,000 |
| 2020 | $31,291 | $1,392,000 | $403,000 | $989,000 |
| 2019 | $30,817 | $1,392,000 | $403,000 | $989,000 |
| 2018 | $30,665 | $1,392,000 | $403,000 | $989,000 |
| 2017 | $0 | $1,392,000 | $403,000 | $989,000 |
| 2016 | $29,003 | $1,326,000 | $337,000 | $989,000 |
| 2015 | -- | $1,326,000 | $337,000 | $989,000 |
| 2014 | -- | $1,195,000 | $337,000 | $858,000 |
| 2013 | -- | $1,195,000 | $337,000 | $858,000 |
Source: Public Records
Map
Nearby Homes
- 16 Elkan Rd
- 4 Burton Rd
- 11 Alden Rd Unit 4a
- 11 Alden Rd Unit 2N
- 11 Alden Rd Unit 6H
- 11 Alden Rd Unit 4C
- 11 Alden Rd Unit 5H
- 11 Alden Rd Unit 4D
- 1299 Palmer Ave Unit 237
- 1299 Palmer Ave Unit 328
- 1299 Palmer Ave Unit 218
- 336 Richbell Rd Unit C4
- 316 Richbell Rd Unit C2
- 1815 Palmer Ave Unit 2V
- 200 Richbell Rd Unit A2
- 208 Richbell Rd Unit C4
- 342 Richbell Rd Unit A4
- 106 Richbell Rd Unit B2
- 124 Richbell Rd Unit A4
- 340 Richbell Rd Unit B4
- 74 Howell Ave
- 72 Howell Ave
- 82 Weaver St
- 80 Weaver St
- 94 Weaver St
- 96 Weaver St
- 98 Weaver St
- 129 Carleon Ave
- 84 Weaver St
- 2 Ferndale Place
- 70 Howell Ave
- 7 Ferndale Place
- 7 Ferndale Place Unit 2nd Fl
- 100 Weaver St
- 75 Howell Ave
- 125 Carleon Ave
- 62 Weaver St
- 9 Ferndale Place
- 102 Weaver St
- 130 Carleon Ave