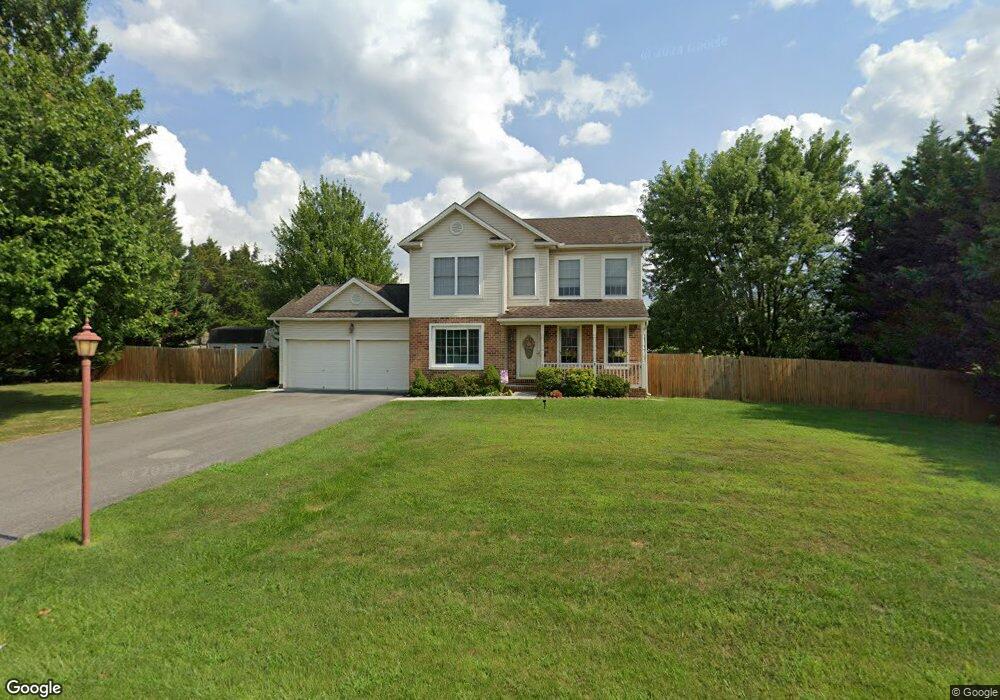
80 Janet St Hanover, PA 17331
Estimated Value: $276,000 - $370,000
3
Beds
3
Baths
1,716
Sq Ft
$192/Sq Ft
Est. Value
About This Home
This home is located at 80 Janet St, Hanover, PA 17331 and is currently estimated at $329,551, approximately $192 per square foot. 80 Janet St is a home located in York County with nearby schools including South Western Senior High School and St Joseph Catholic School.
Ownership History
Date
Name
Owned For
Owner Type
Purchase Details
Closed on
Jun 27, 2005
Sold by
Mcnally John F and Mcnally Josephine L
Bought by
Lamison Robert G and Lamison Holly L
Current Estimated Value
Home Financials for this Owner
Home Financials are based on the most recent Mortgage that was taken out on this home.
Original Mortgage
$210,000
Outstanding Balance
$109,693
Interest Rate
5.67%
Mortgage Type
Fannie Mae Freddie Mac
Estimated Equity
$219,858
Purchase Details
Closed on
Sep 30, 2003
Sold by
Bon Ton Builders Inc
Bought by
Mcnally John F and Mcnally Josephine L
Home Financials for this Owner
Home Financials are based on the most recent Mortgage that was taken out on this home.
Original Mortgage
$181,000
Interest Rate
8.6%
Mortgage Type
Purchase Money Mortgage
Purchase Details
Closed on
Mar 27, 2003
Sold by
Brady Camille C and Brady Donald R
Bought by
Bon Ton Builders Inc
Create a Home Valuation Report for This Property
The Home Valuation Report is an in-depth analysis detailing your home's value as well as a comparison with similar homes in the area
Home Values in the Area
Average Home Value in this Area
Purchase History
| Date | Buyer | Sale Price | Title Company |
|---|---|---|---|
| Lamison Robert G | $270,000 | Fountainhead Title Group | |
| Mcnally John F | $181,000 | -- | |
| Bon Ton Builders Inc | $35,000 | -- |
Source: Public Records
Mortgage History
| Date | Status | Borrower | Loan Amount |
|---|---|---|---|
| Open | Lamison Robert G | $210,000 | |
| Previous Owner | Mcnally John F | $181,000 |
Source: Public Records
Tax History Compared to Growth
Tax History
| Year | Tax Paid | Tax Assessment Tax Assessment Total Assessment is a certain percentage of the fair market value that is determined by local assessors to be the total taxable value of land and additions on the property. | Land | Improvement |
|---|---|---|---|---|
| 2025 | $6,276 | $186,240 | $27,420 | $158,820 |
| 2024 | $6,276 | $186,240 | $27,420 | $158,820 |
| 2023 | $6,165 | $186,240 | $27,420 | $158,820 |
| 2022 | $6,032 | $186,240 | $27,420 | $158,820 |
| 2021 | $5,703 | $186,240 | $27,420 | $158,820 |
| 2020 | $5,703 | $186,240 | $27,420 | $158,820 |
| 2019 | $5,593 | $186,240 | $27,420 | $158,820 |
| 2018 | $5,519 | $186,240 | $27,420 | $158,820 |
| 2017 | $5,392 | $186,240 | $27,420 | $158,820 |
| 2016 | $0 | $186,240 | $27,420 | $158,820 |
| 2015 | -- | $186,240 | $27,420 | $158,820 |
| 2014 | -- | $184,200 | $27,420 | $156,780 |
Source: Public Records
Map
Nearby Homes
- 917 Baltimore St
- 977 Baltimore St
- 9 Little Knoll Dr
- 832 Baltimore St
- 104 Stonewicke Dr Unit 86
- 1280 Maple Ln Unit 10
- 430 Ripple Dr Unit 53
- 440 Ripple Dr Unit 52
- 1 Little Way Unit 79
- 6 Little Way Unit 64
- 5 Little Way Unit 65
- 22 Meadow Ln Unit 19
- 24 Meadow Ln Unit 18
- 540 Ripple Dr Unit 47
- 201 Fieldstone Dr Unit 23
- 55 Wilmar Ave Unit 12
- 560 Ripple Dr Unit 45
- 570 Ripple Dr Unit 44
- 1511 Maple Ln Unit 185
- 1501 Maple Ln Unit 184
- 75 Janet St
- 947 Baltimore St
- 943 Baltimore St
- 930 S Franklin St
- 939 Baltimore St
- 937 Baltimore St
- 935 Baltimore St
- 955 Baltimore St
- 933 Baltimore St
- 928 S Franklin St
- 931 S Franklin St
- 0 Baltimore St Unit 21408640
- 0 Baltimore St Unit 16 PAYK2079352
- 929 S Franklin St
- 926 S Franklin St
- 120 Janet St
- 927 Baltimore St
- 924 S Franklin St
- 924 1/2 S Franklin St
- 925 Baltimore St