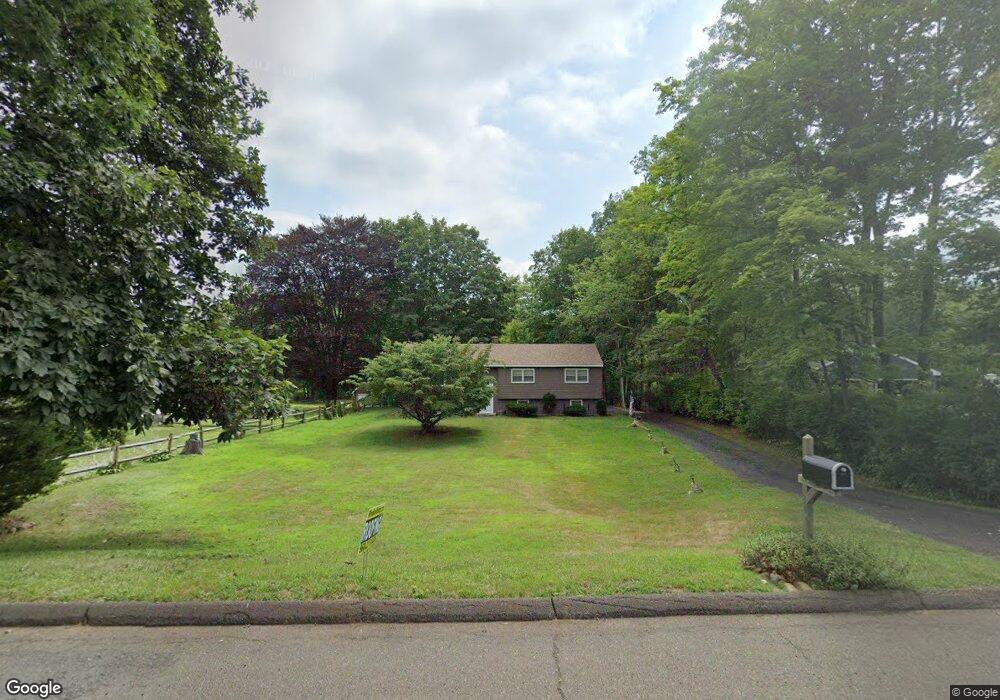
80 Jobs Rd Wallingford, CT 06492
Estimated Value: $360,000 - $462,000
3
Beds
2
Baths
1,242
Sq Ft
$337/Sq Ft
Est. Value
About This Home
This home is located at 80 Jobs Rd, Wallingford, CT 06492 and is currently estimated at $418,757, approximately $337 per square foot. 80 Jobs Rd is a home located in New Haven County with nearby schools including Moses Y Beach Elementary School, Rock Hill Elementary School, and Dag Hammarskjold Middle School.
Ownership History
Date
Name
Owned For
Owner Type
Purchase Details
Closed on
May 11, 2016
Sold by
Gayton Gertrude
Bought by
Gayton Arthur
Current Estimated Value
Home Financials for this Owner
Home Financials are based on the most recent Mortgage that was taken out on this home.
Original Mortgage
$152,000
Outstanding Balance
$121,199
Interest Rate
3.71%
Mortgage Type
Purchase Money Mortgage
Estimated Equity
$297,558
Purchase Details
Closed on
Dec 18, 1972
Bought by
Gayton Arthur W and Gayton Gertrude S
Create a Home Valuation Report for This Property
The Home Valuation Report is an in-depth analysis detailing your home's value as well as a comparison with similar homes in the area
Home Values in the Area
Average Home Value in this Area
Purchase History
| Date | Buyer | Sale Price | Title Company |
|---|---|---|---|
| Gayton Arthur | $199,000 | -- | |
| Gayton Arthur W | -- | -- |
Source: Public Records
Mortgage History
| Date | Status | Borrower | Loan Amount |
|---|---|---|---|
| Open | Gayton Arthur W | $152,000 | |
| Previous Owner | Gayton Arthur W | $115,000 | |
| Previous Owner | Gayton Arthur W | $110,000 |
Source: Public Records
Tax History Compared to Growth
Tax History
| Year | Tax Paid | Tax Assessment Tax Assessment Total Assessment is a certain percentage of the fair market value that is determined by local assessors to be the total taxable value of land and additions on the property. | Land | Improvement |
|---|---|---|---|---|
| 2025 | $6,693 | $277,500 | $126,400 | $151,100 |
| 2024 | $6,221 | $202,900 | $105,400 | $97,500 |
| 2023 | $5,953 | $202,900 | $105,400 | $97,500 |
| 2022 | $5,892 | $202,900 | $105,400 | $97,500 |
| 2021 | $7,313 | $202,900 | $105,400 | $97,500 |
| 2020 | $5,438 | $186,300 | $101,000 | $85,300 |
| 2019 | $5,438 | $186,300 | $101,000 | $85,300 |
| 2018 | $5,336 | $186,300 | $101,000 | $85,300 |
| 2017 | $5,319 | $186,300 | $101,000 | $85,300 |
| 2016 | $5,196 | $186,300 | $101,000 | $85,300 |
| 2015 | $5,184 | $188,700 | $101,000 | $87,700 |
| 2014 | $5,074 | $188,700 | $101,000 | $87,700 |
Source: Public Records
Map
Nearby Homes
- 940 Durham Rd
- 37 Laurelwood Dr
- 28 Morgan Dr
- 350 Williams Rd
- 400 Williams Rd
- 1 Pine Glen Terrace
- 11 Westview Dr
- 7 Grantham Rd
- 5 Stegos Dr
- 4 Sunset Dr
- 670 Williams Rd
- 1323 Barnes Rd
- 530 Center St Unit C1
- 29 Curtis Ave
- 43 Academy St
- 19 Carriage Dr
- 39 Hoffman Ct Unit B3
- 44 3rd St
- 41 Northford Rd
- 6 Holly Ln