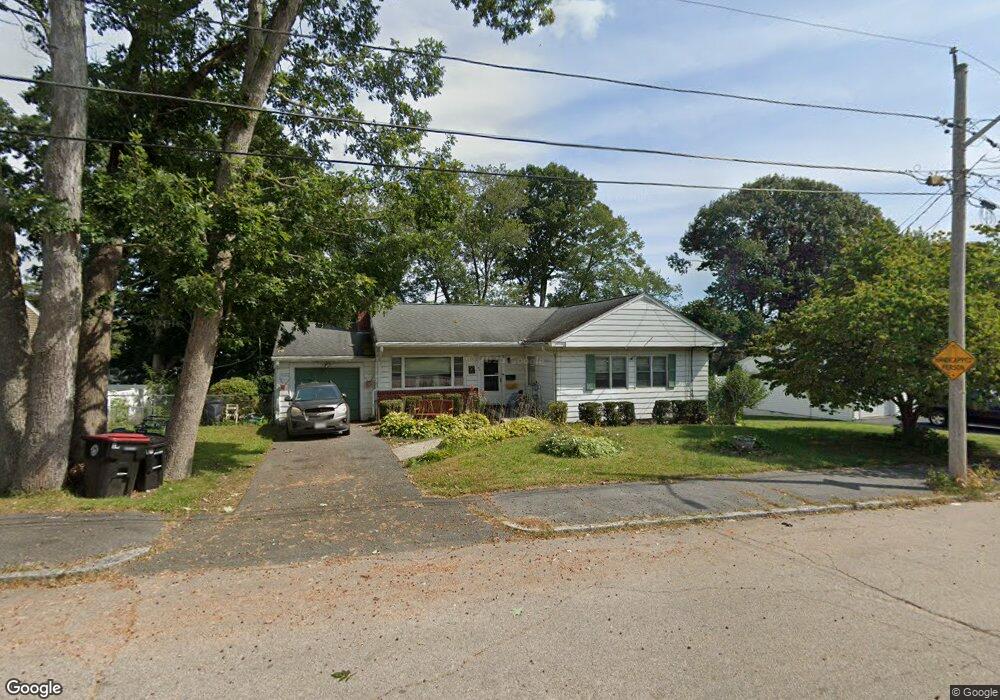
80 Lenox St Brockton, MA 02301
Estimated Value: $457,000 - $547,506
3
Beds
1
Bath
1,812
Sq Ft
$286/Sq Ft
Est. Value
About This Home
This home is located at 80 Lenox St, Brockton, MA 02301 and is currently estimated at $517,377, approximately $285 per square foot. 80 Lenox St is a home located in Plymouth County with nearby schools including Manthala George Jr. School, Hancock Elementary School, and Louis F Angelo Elementary School.
Ownership History
Date
Name
Owned For
Owner Type
Purchase Details
Closed on
May 28, 1992
Sold by
Jnp Rt
Bought by
Carlozzi Roderick A and Carlozzi Annemarie
Current Estimated Value
Home Financials for this Owner
Home Financials are based on the most recent Mortgage that was taken out on this home.
Original Mortgage
$104,500
Interest Rate
8.7%
Mortgage Type
Purchase Money Mortgage
Create a Home Valuation Report for This Property
The Home Valuation Report is an in-depth analysis detailing your home's value as well as a comparison with similar homes in the area
Home Values in the Area
Average Home Value in this Area
Purchase History
| Date | Buyer | Sale Price | Title Company |
|---|---|---|---|
| Carlozzi Roderick A | $110,000 | -- |
Source: Public Records
Mortgage History
| Date | Status | Borrower | Loan Amount |
|---|---|---|---|
| Open | Carlozzi Roderick A | $102,000 | |
| Closed | Carlozzi Roderick A | $128,000 | |
| Closed | Carlozzi Roderick A | $103,700 | |
| Closed | Carlozzi Roderick A | $104,500 |
Source: Public Records
Tax History Compared to Growth
Tax History
| Year | Tax Paid | Tax Assessment Tax Assessment Total Assessment is a certain percentage of the fair market value that is determined by local assessors to be the total taxable value of land and additions on the property. | Land | Improvement |
|---|---|---|---|---|
| 2025 | $5,419 | $447,500 | $147,100 | $300,400 |
| 2024 | $5,159 | $429,200 | $147,100 | $282,100 |
| 2023 | $5,209 | $401,300 | $112,200 | $289,100 |
| 2022 | $4,955 | $354,700 | $102,100 | $252,600 |
| 2021 | $4,512 | $311,200 | $96,300 | $214,900 |
| 2020 | $4,272 | $282,000 | $92,300 | $189,700 |
| 2019 | $4,306 | $277,100 | $86,600 | $190,500 |
| 2018 | $3,930 | $244,700 | $86,600 | $158,100 |
| 2017 | $3,830 | $237,900 | $86,600 | $151,300 |
| 2016 | $3,771 | $217,200 | $78,500 | $138,700 |
| 2015 | $3,331 | $183,500 | $78,500 | $105,000 |
| 2014 | $3,169 | $174,800 | $78,500 | $96,300 |
Source: Public Records
Map
Nearby Homes
- 25 Monson St
- 37 West St
- 28 Fern Ave
- 17 Moraine Place
- 20 Montauk Rd
- 48 N Belcher Ave
- 21 Oneida Ave
- 67 Sycamore Ave Unit 3
- 161 Moraine St
- 72 W Elm Terrace
- 77 Colonel Bell Dr Unit 4
- 61 Fairfield St
- 141 Prospect Ave
- 281 Spring St
- 175 Belmont Ave
- 190 Highland St
- 15 Byron Ave
- 114 Crickett Rd
- 45 Cross St
- 78 Keene St