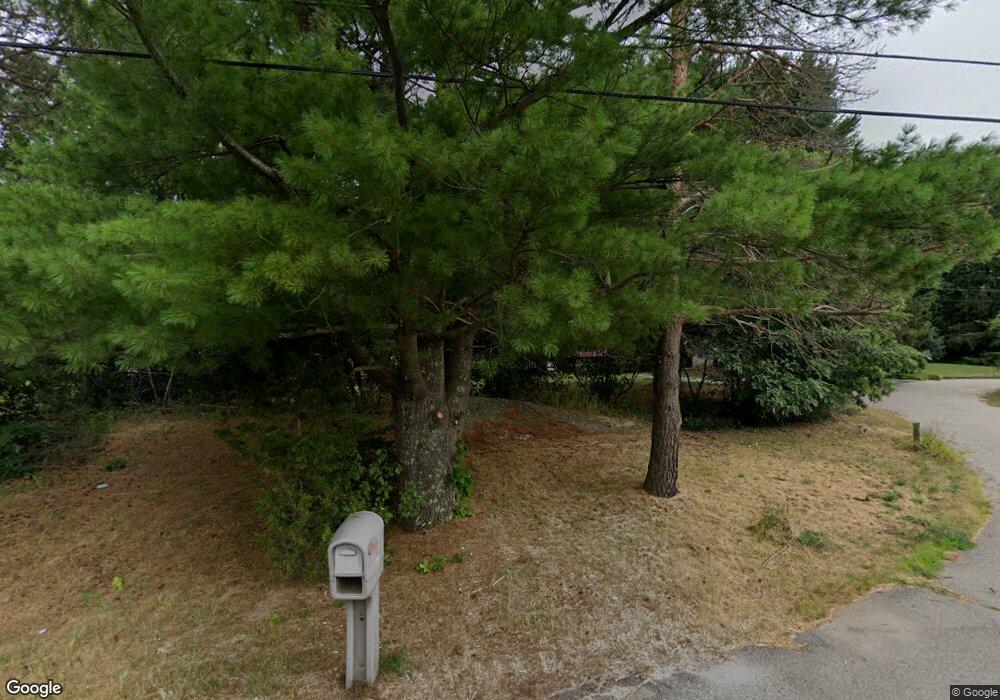
80 Morse Ave Attleboro, MA 02703
Estimated Value: $508,000 - $645,000
4
Beds
3
Baths
1,892
Sq Ft
$313/Sq Ft
Est. Value
About This Home
This home is located at 80 Morse Ave, Attleboro, MA 02703 and is currently estimated at $592,385, approximately $313 per square foot. 80 Morse Ave is a home located in Bristol County with nearby schools including Hill-Roberts Elementary School, Robert J. Coelho Middle School, and Attleboro High School.
Ownership History
Date
Name
Owned For
Owner Type
Purchase Details
Closed on
Sep 14, 2001
Sold by
Olson Mario D and Olson Madeline F
Bought by
Universal Mtg Corp
Current Estimated Value
Purchase Details
Closed on
Jun 24, 1993
Sold by
Baris Yvette J
Bought by
Finlayson Ruth and Olson Madeline
Create a Home Valuation Report for This Property
The Home Valuation Report is an in-depth analysis detailing your home's value as well as a comparison with similar homes in the area
Home Values in the Area
Average Home Value in this Area
Purchase History
| Date | Buyer | Sale Price | Title Company |
|---|---|---|---|
| Universal Mtg Corp | $209,000 | -- | |
| Finlayson Ruth | $147,500 | -- |
Source: Public Records
Mortgage History
| Date | Status | Borrower | Loan Amount |
|---|---|---|---|
| Open | Finlayson Ruth | $371,658 | |
| Closed | Finlayson Ruth | $371,658 |
Source: Public Records
Tax History
| Year | Tax Paid | Tax Assessment Tax Assessment Total Assessment is a certain percentage of the fair market value that is determined by local assessors to be the total taxable value of land and additions on the property. | Land | Improvement |
|---|---|---|---|---|
| 2025 | $6,636 | $528,800 | $178,800 | $350,000 |
| 2024 | $6,397 | $502,500 | $161,400 | $341,100 |
| 2023 | $6,240 | $455,800 | $163,000 | $292,800 |
| 2022 | $5,923 | $409,900 | $155,600 | $254,300 |
| 2021 | $4,859 | $372,800 | $149,800 | $223,000 |
| 2020 | $5,180 | $355,800 | $143,200 | $212,600 |
| 2019 | $4,899 | $346,000 | $140,600 | $205,400 |
| 2018 | $3,642 | $317,000 | $136,600 | $180,400 |
| 2017 | $4,573 | $314,300 | $133,200 | $181,100 |
| 2016 | $4,253 | $287,000 | $124,900 | $162,100 |
| 2015 | $4,200 | $285,500 | $124,900 | $160,600 |
| 2014 | $4,026 | $271,100 | $119,400 | $151,700 |
Source: Public Records
Map
Nearby Homes
Your Personal Tour Guide
Ask me questions while you tour the home.