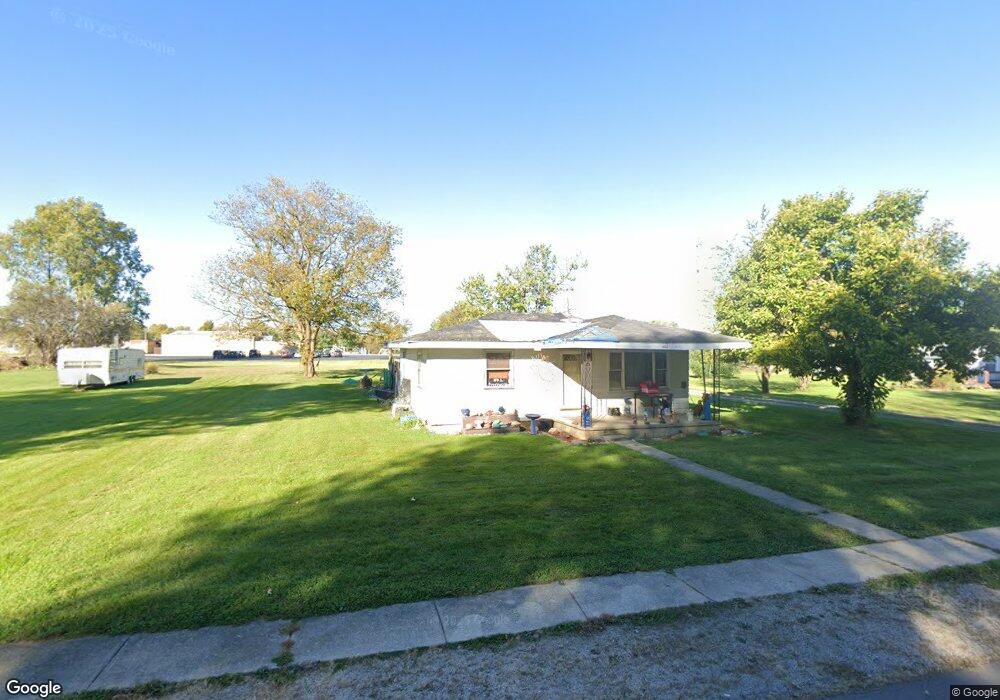
80 N Sycamore St Redkey, IN 47373
Estimated Value: $67,958 - $128,000
2
Beds
1
Bath
768
Sq Ft
$113/Sq Ft
Est. Value
About This Home
This home is located at 80 N Sycamore St, Redkey, IN 47373 and is currently estimated at $86,490, approximately $112 per square foot. 80 N Sycamore St is a home located in Jay County.
Ownership History
Date
Name
Owned For
Owner Type
Purchase Details
Closed on
May 20, 2020
Sold by
Linda Burks
Bought by
Elmore Deborah A
Current Estimated Value
Create a Home Valuation Report for This Property
The Home Valuation Report is an in-depth analysis detailing your home's value as well as a comparison with similar homes in the area
Purchase History
We collect this data history from publicly available records. To have your information removed, we recommend requesting removal directly through your county’s website.
| Date | Buyer | Sale Price | Title Company |
|---|---|---|---|
| Elmore Deborah A | -- | -- |
Source: Public Records
Tax History
| Year | Tax Paid | Tax Assessment Tax Assessment Total Assessment is a certain percentage of the fair market value that is determined by local assessors to be the total taxable value of land and additions on the property. | Land | Improvement |
|---|---|---|---|---|
| 2025 | $589 | $27,800 | $8,200 | $19,600 |
| 2024 | $559 | $26,300 | $8,200 | $18,100 |
| 2023 | $592 | $27,800 | $9,200 | $18,600 |
| 2022 | $576 | $28,000 | $9,200 | $18,800 |
| 2021 | $529 | $25,600 | $9,200 | $16,400 |
| 2020 | $530 | $25,600 | $9,200 | $16,400 |
| 2019 | $20 | $24,000 | $7,600 | $16,400 |
| 2018 | $20 | $26,000 | $7,600 | $18,400 |
| 2017 | $20 | $25,100 | $7,600 | $17,500 |
| 2016 | -- | $24,200 | $7,600 | $16,600 |
| 2014 | -- | $17,100 | $7,600 | $9,500 |
| 2013 | -- | $16,300 | $7,600 | $8,700 |
Source: Public Records
Map
Nearby Homes
- 210 N Oak St
- 10071 W 400 S
- 104 Rick Dr
- 0 Auburn St Unit 202545217
- 363 E North St
- 355 E North St
- 347 E North St
- 333 E Ohio St
- 615 Hart Dr
- 234 E Commerce St
- 233 E Commerce St
- 228 E Commerce St
- 129 E Washington St
- 129 E Washington St Unit Dunkirk
- 202 W Jay St Unit Dunkirk
- 208 W Jay St
- 210 W Jay St
- 706 N Main St
- 228 N Meridian St
- 211 W Pearl St
- 86 N Sycamore St
- 47 N Sycamore St
- 53 N Sycamore St
- 45 N Sycamore St
- 44 N Sycamore St
- 110 N Sycamore St
- 43 N Sycamore St
- 140 N Ash St
- 146 N Ash St
- 116 N Sycamore St
- 40 N Sycamore St
- 117 N Sycamore St
- 120 N Ash St
- 132 N Ash St
- 126 N Ash St
- 38 N Sycamore St
- 33 N Sycamore St
- 120 N Sycamore St
- 116 N Ash St
- 9245 Indiana 67
Your Personal Tour Guide
Ask me questions while you tour the home.