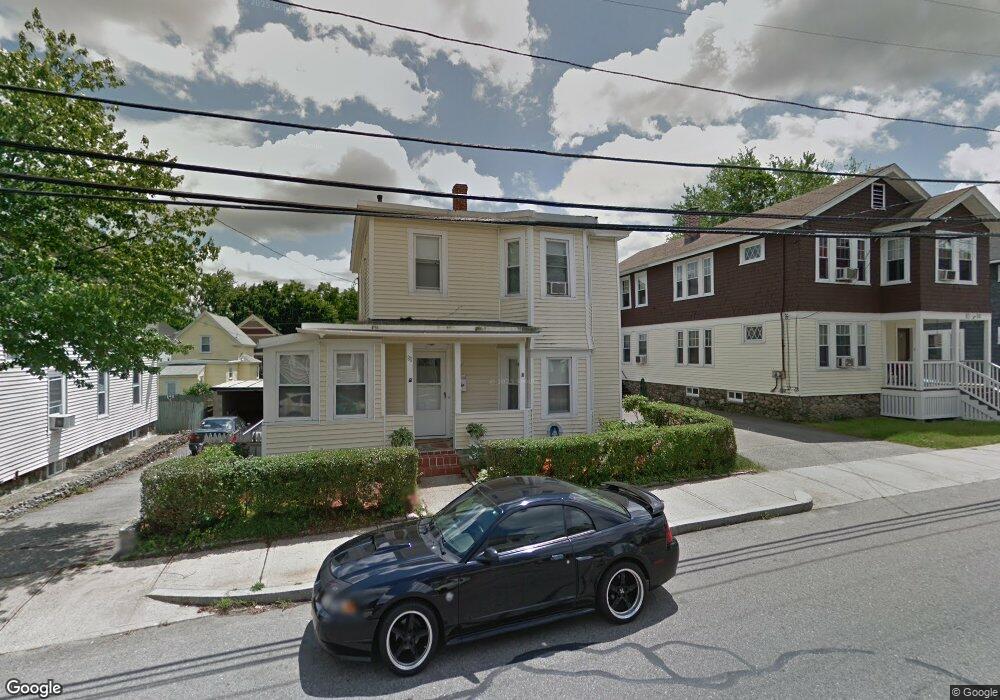
80 Oakland Ave Methuen, MA 01844
Downtown Methuen NeighborhoodEstimated Value: $482,000 - $541,000
3
Beds
2
Baths
1,230
Sq Ft
$410/Sq Ft
Est. Value
About This Home
This home is located at 80 Oakland Ave, Methuen, MA 01844 and is currently estimated at $504,355, approximately $410 per square foot. 80 Oakland Ave is a home located in Essex County with nearby schools including Marsh Grammar School, South Point Elementary School, and Methuen High School.
Ownership History
Date
Name
Owned For
Owner Type
Purchase Details
Closed on
Feb 16, 2012
Sold by
Bastardo Carmen M
Bought by
Bastardo Miguel A
Current Estimated Value
Purchase Details
Closed on
Dec 20, 2004
Sold by
Snyder Corrine T and Snyder Jason M
Bought by
Bastardo Carmen M and Bastardo Miguel A
Home Financials for this Owner
Home Financials are based on the most recent Mortgage that was taken out on this home.
Original Mortgage
$209,467
Interest Rate
5.68%
Mortgage Type
Purchase Money Mortgage
Purchase Details
Closed on
Sep 22, 1994
Sold by
Mulvey Henry A
Bought by
Norton Frank
Home Financials for this Owner
Home Financials are based on the most recent Mortgage that was taken out on this home.
Original Mortgage
$59,800
Interest Rate
8.56%
Mortgage Type
Purchase Money Mortgage
Create a Home Valuation Report for This Property
The Home Valuation Report is an in-depth analysis detailing your home's value as well as a comparison with similar homes in the area
Home Values in the Area
Average Home Value in this Area
Purchase History
| Date | Buyer | Sale Price | Title Company |
|---|---|---|---|
| Bastardo Miguel A | -- | -- | |
| Bastardo Miguel A | -- | -- | |
| Bastardo Carmen M | $233,000 | -- | |
| Bastardo Carmen M | $233,000 | -- | |
| Norton Frank | $65,000 | -- | |
| Norton Frank | $65,000 | -- |
Source: Public Records
Mortgage History
| Date | Status | Borrower | Loan Amount |
|---|---|---|---|
| Previous Owner | Bastardo Carmen M | $209,467 | |
| Previous Owner | Norton Frank | $66,000 | |
| Previous Owner | Norton Frank | $59,800 |
Source: Public Records
Tax History Compared to Growth
Tax History
| Year | Tax Paid | Tax Assessment Tax Assessment Total Assessment is a certain percentage of the fair market value that is determined by local assessors to be the total taxable value of land and additions on the property. | Land | Improvement |
|---|---|---|---|---|
| 2025 | $4,485 | $423,900 | $190,900 | $233,000 |
| 2024 | $4,361 | $401,600 | $174,200 | $227,400 |
| 2023 | $4,189 | $358,000 | $154,800 | $203,200 |
| 2022 | $3,890 | $298,100 | $122,600 | $175,500 |
| 2021 | $3,671 | $278,300 | $116,100 | $162,200 |
| 2020 | $3,652 | $271,700 | $116,100 | $155,600 |
| 2019 | $3,530 | $248,800 | $109,700 | $139,100 |
| 2018 | $3,368 | $236,000 | $103,200 | $132,800 |
| 2017 | $3,296 | $225,000 | $103,200 | $121,800 |
| 2016 | $3,107 | $209,800 | $90,300 | $119,500 |
| 2015 | $2,999 | $205,400 | $90,300 | $115,100 |
Source: Public Records
Map
Nearby Homes
- 20-22 Ashland Ave
- 24 Railroad St
- 83 Arnold St
- 47 Lowell St
- 23 Chase St
- 2 Horne St
- 190-192 Oakland Ave
- 17-19 Maplewood Ave
- 197 Oakland Ave
- 35 Hardy St
- 69 Broadway
- 37 Maplewood Ave
- 32 Morrison Ct
- 100-102 Phillips St
- 8 Francella Rd
- 52 High St Unit 5
- 26 Gage St
- 206-208 Willow St
- 179-181 West St
- 18 Larchwood Rd
- 82 Oakland Ave Unit 84
- 82-84 Oakland Ave
- 76-78 Oakland Ave
- 76 Oakland Ave Unit 78
- 23 Ashland Ave
- 86 1/2 Oakland Ave
- 74 Oakland Ave
- 21 Ashland Ave
- 25 Ashland Ave
- 86 Oakland Ave
- 85 Oakland Ave Unit 87
- 27 Ashland Ave
- 17 Ashland Ave Unit 19
- 81 Oakland Ave Unit 83
- 81-83 Oakland Ave
- 89 Oakland Ave Unit 91
- 88 1/2 Oakland Ave
- 88- Oakland Avenue 88 1 2
- 72 Oakland Ave
- 77 Oakland Ave