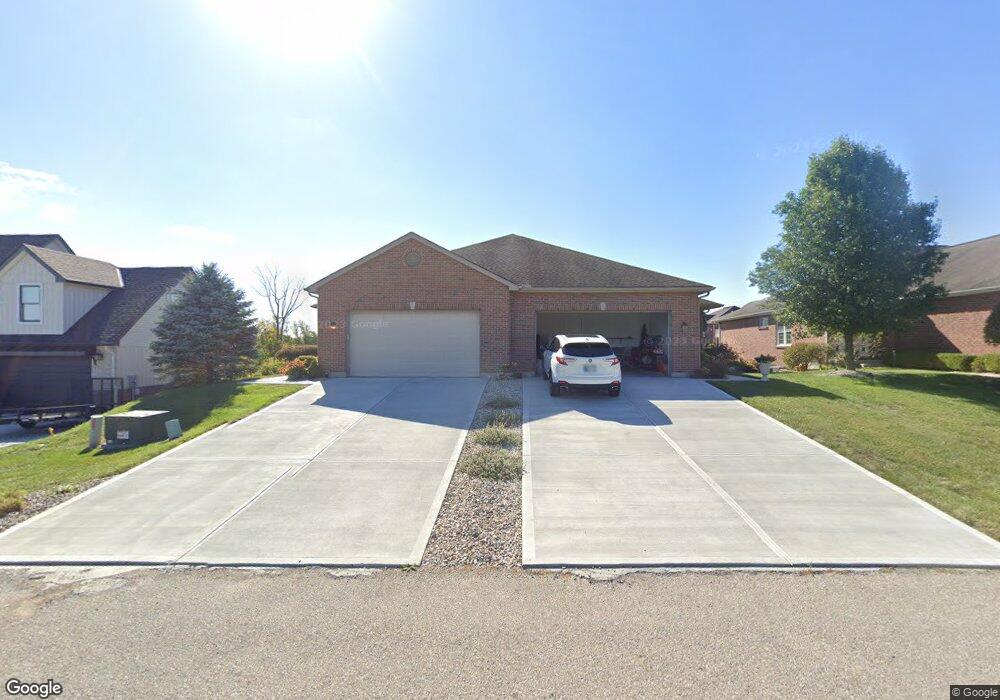
80 Oakmont Ct Lawrenceburg, IN 47025
Estimated Value: $449,953 - $502,000
3
Beds
4
Baths
1,863
Sq Ft
$258/Sq Ft
Est. Value
About This Home
This home is located at 80 Oakmont Ct, Lawrenceburg, IN 47025 and is currently estimated at $479,738, approximately $257 per square foot. 80 Oakmont Ct is a home located in Dearborn County with nearby schools including East Central High School.
Ownership History
Date
Name
Owned For
Owner Type
Purchase Details
Closed on
Dec 17, 2021
Sold by
Espel Micheal C and Espel Mary Beth
Bought by
Espel Micheal C and Espel Mary Beth
Current Estimated Value
Purchase Details
Closed on
Jul 13, 2007
Sold by
Roell Kenneth J
Bought by
Espel Michael C and Espel Mary B
Home Financials for this Owner
Home Financials are based on the most recent Mortgage that was taken out on this home.
Original Mortgage
$296,000
Interest Rate
6.76%
Mortgage Type
Stand Alone First
Create a Home Valuation Report for This Property
The Home Valuation Report is an in-depth analysis detailing your home's value as well as a comparison with similar homes in the area
Home Values in the Area
Average Home Value in this Area
Purchase History
| Date | Buyer | Sale Price | Title Company |
|---|---|---|---|
| Espel Micheal C | -- | None Listed On Document | |
| Espel Michael C | -- | None Listed On Document | |
| Espel Michael C | -- | -- |
Source: Public Records
Mortgage History
| Date | Status | Borrower | Loan Amount |
|---|---|---|---|
| Previous Owner | Espel Michael C | $296,000 |
Source: Public Records
Tax History Compared to Growth
Tax History
| Year | Tax Paid | Tax Assessment Tax Assessment Total Assessment is a certain percentage of the fair market value that is determined by local assessors to be the total taxable value of land and additions on the property. | Land | Improvement |
|---|---|---|---|---|
| 2024 | $3,153 | $320,200 | $60,500 | $259,700 |
| 2023 | $2,971 | $311,800 | $60,500 | $251,300 |
| 2022 | $3,250 | $347,300 | $60,500 | $286,800 |
| 2021 | $3,268 | $326,800 | $60,500 | $266,300 |
| 2020 | $3,302 | $330,200 | $60,500 | $269,700 |
| 2019 | $3,336 | $333,600 | $60,500 | $273,100 |
| 2018 | $3,369 | $336,900 | $60,500 | $276,400 |
| 2017 | $2,788 | $278,800 | $60,500 | $218,300 |
| 2016 | $2,795 | $281,500 | $60,500 | $221,000 |
| 2014 | $2,767 | $277,400 | $60,500 | $216,900 |
Source: Public Records
Map
Nearby Homes
- 0 Augusta Dr Unit 203634
- 0 Augusta Dr Unit 193297
- 0 Augusta Dr Unit 193296
- 46 Pebble Beach Ln Unit 3G
- 368 Muirfield Point
- 20955 Ferngrove Ct
- 270 Cresthaven Dr
- 10869 Sand Run Rd
- 0 Cresthaven Dr Unit 204573
- 0 Cresthaven Dr Unit 198527
- 747 Hickory Rd
- 795 Madison Ridge Rd
- 1525 Lakeview Dr
- 11015 Sand Run Rd
- 21070 Alpine Dr
- 00 Longview Dr
- 19534 Longview Dr
- 10883 Sand Run Rd
- 1274 Skyview Cir
- 11225 U S 50
- 86 Oakmont Ct
- 88 Oakmont Ct
- 90 Oakmont Ct
- 62 Oakmont Ct
- 0 Oakmont Ct Unit 85 1313941
- 0 Oakmont Ct Unit 84 1313939
- 0 Oakmont Ct Unit 83 1313938
- 0 Oakmont Ct Unit 265399
- 0 Oakmont Ct Unit 265398
- 0 Oakmont Ct Unit 265396
- 0 Oakmont Ct Unit 265397
- 0 Oakmont Ct Unit 265395
- 0 Oakmont Ct Unit 266917
- 0 Oakmont Ct Unit 266915
- 0 Oakmont Ct Unit 278709
- 0 Oakmont Ct Unit 278708
- 0 Oakmont Ct Unit 278703
- 51 Oakmont Ct
- 91 Oakmont Ct
- 99 Oakmont Ct