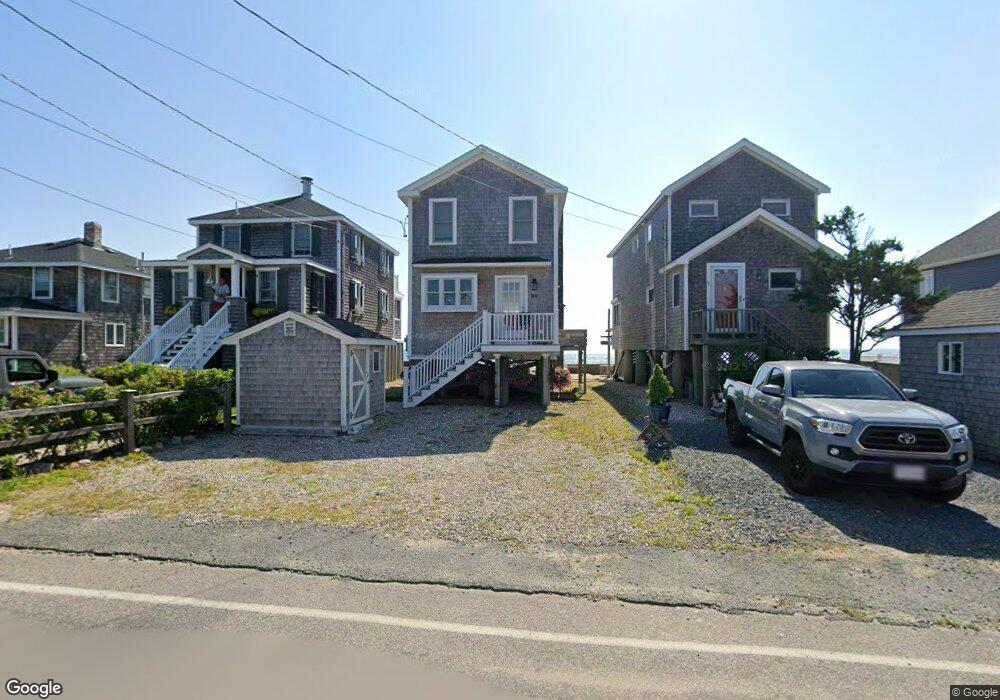
80 Ocean St Unit 80 Marshfield, MA 02050
Ocean Bluff-Brant Rock NeighborhoodEstimated Value: $944,000 - $1,130,000
3
Beds
3
Baths
1,244
Sq Ft
$808/Sq Ft
Est. Value
About This Home
This home is located at 80 Ocean St Unit 80, Marshfield, MA 02050 and is currently estimated at $1,004,985, approximately $807 per square foot. 80 Ocean St Unit 80 is a home located in Plymouth County with nearby schools including Governor Edward Winslow School, Furnace Brook Middle School, and Marshfield High School.
Ownership History
Date
Name
Owned For
Owner Type
Purchase Details
Closed on
Sep 21, 2012
Sold by
Maguire April D and Maguire Edward F
Bought by
Maguire Edward F
Current Estimated Value
Purchase Details
Closed on
Dec 31, 1992
Sold by
Pinkham David M and Lotti George P
Bought by
Maguire Edward F and Maguire April D
Purchase Details
Closed on
Oct 23, 1992
Sold by
Hankey Edna J
Bought by
Pinkham David M and Lotti George P
Create a Home Valuation Report for This Property
The Home Valuation Report is an in-depth analysis detailing your home's value as well as a comparison with similar homes in the area
Home Values in the Area
Average Home Value in this Area
Purchase History
| Date | Buyer | Sale Price | Title Company |
|---|---|---|---|
| Maguire Edward F | -- | -- | |
| Maguire Edward F | -- | -- | |
| Maguire Edward F | $195,750 | -- | |
| Pinkham David M | $115,000 | -- |
Source: Public Records
Mortgage History
| Date | Status | Borrower | Loan Amount |
|---|---|---|---|
| Previous Owner | Pinkham David M | $197,400 | |
| Previous Owner | Pinkham David M | $131,000 | |
| Previous Owner | Pinkham David M | $47,000 |
Source: Public Records
Tax History Compared to Growth
Tax History
| Year | Tax Paid | Tax Assessment Tax Assessment Total Assessment is a certain percentage of the fair market value that is determined by local assessors to be the total taxable value of land and additions on the property. | Land | Improvement |
|---|---|---|---|---|
| 2025 | $8,919 | $900,900 | $604,800 | $296,100 |
| 2024 | $8,313 | $800,100 | $532,800 | $267,300 |
| 2023 | $6,935 | $692,500 | $460,800 | $231,700 |
| 2022 | $6,935 | $535,500 | $338,400 | $197,100 |
| 2021 | $6,831 | $517,900 | $338,400 | $179,500 |
| 2020 | $6,065 | $455,000 | $316,800 | $138,200 |
| 2019 | $6,250 | $467,100 | $316,800 | $150,300 |
| 2018 | $6,209 | $464,400 | $316,800 | $147,600 |
| 2017 | $6,221 | $453,400 | $316,800 | $136,600 |
| 2016 | $6,318 | $455,200 | $316,800 | $138,400 |
| 2015 | $6,775 | $509,800 | $374,400 | $135,400 |
| 2014 | $6,654 | $500,700 | $374,400 | $126,300 |
Source: Public Records
Map
Nearby Homes