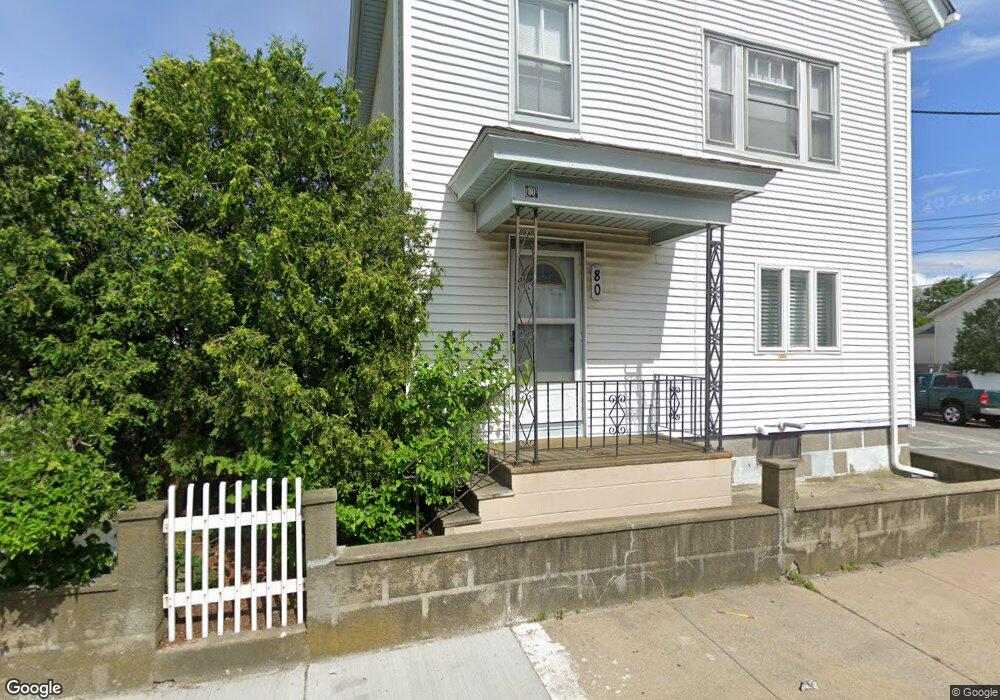
80 Quarry St Fall River, MA 02723
Flint NeighborhoodEstimated Value: $446,749 - $528,000
4
Beds
2
Baths
2,202
Sq Ft
$220/Sq Ft
Est. Value
About This Home
This home is located at 80 Quarry St, Fall River, MA 02723 and is currently estimated at $483,687, approximately $219 per square foot. 80 Quarry St is a home located in Bristol County with nearby schools including Mary Fonseca Elementary School, Talbot Innovation School, and B M C Durfee High School.
Ownership History
Date
Name
Owned For
Owner Type
Purchase Details
Closed on
Sep 12, 1995
Sold by
Raposo Gilberto and Raposo Maria
Bought by
Pereira Marcelino and Pereira Filomena
Current Estimated Value
Home Financials for this Owner
Home Financials are based on the most recent Mortgage that was taken out on this home.
Original Mortgage
$120,650
Interest Rate
7.8%
Mortgage Type
Purchase Money Mortgage
Purchase Details
Closed on
Aug 8, 1988
Sold by
Carvalho Fran F
Bought by
Reis Manuel J
Home Financials for this Owner
Home Financials are based on the most recent Mortgage that was taken out on this home.
Original Mortgage
$100,000
Interest Rate
10.36%
Mortgage Type
Purchase Money Mortgage
Create a Home Valuation Report for This Property
The Home Valuation Report is an in-depth analysis detailing your home's value as well as a comparison with similar homes in the area
Home Values in the Area
Average Home Value in this Area
Purchase History
| Date | Buyer | Sale Price | Title Company |
|---|---|---|---|
| Pereira Marcelino | $127,000 | -- | |
| Reis Manuel J | $125,000 | -- |
Source: Public Records
Mortgage History
| Date | Status | Borrower | Loan Amount |
|---|---|---|---|
| Open | Reis Manuel J | $115,000 | |
| Closed | Reis Manuel J | $120,650 | |
| Previous Owner | Reis Manuel J | $98,000 | |
| Previous Owner | Reis Manuel J | $100,000 |
Source: Public Records
Tax History
| Year | Tax Paid | Tax Assessment Tax Assessment Total Assessment is a certain percentage of the fair market value that is determined by local assessors to be the total taxable value of land and additions on the property. | Land | Improvement |
|---|---|---|---|---|
| 2025 | $4,504 | $393,400 | $101,700 | $291,700 |
| 2024 | $4,080 | $355,100 | $94,900 | $260,200 |
| 2023 | $3,723 | $303,400 | $79,700 | $223,700 |
| 2022 | $3,436 | $272,300 | $75,800 | $196,500 |
| 2021 | $3,063 | $221,500 | $72,600 | $148,900 |
| 2020 | $2,728 | $188,800 | $70,200 | $118,600 |
| 2019 | $2,623 | $179,900 | $70,200 | $109,700 |
| 2018 | $2,490 | $170,300 | $74,400 | $95,900 |
| 2017 | $2,307 | $164,800 | $74,400 | $90,400 |
| 2016 | $2,440 | $179,000 | $91,000 | $88,000 |
| 2015 | $2,296 | $175,500 | $87,500 | $88,000 |
| 2014 | $2,433 | $193,400 | $97,200 | $96,200 |
Source: Public Records
Map
Nearby Homes
- 139 Quarry St
- 869 Bedford St
- 84 Healy St
- 105 16th St
- 120 15th St Unit 5
- 10 Carlisa Dr
- 129 County St
- 847 Pleasant St
- 217 Plain St
- 992 Pine St
- 218 Plain St
- 1155-1157 Pleasant St
- 88 Harrison St Unit 5
- 884 Cherry St
- 273 Tremont St
- 70 Jencks St
- 243 Robeson St Unit 6
- 243 Robeson St Unit 3
- 1244 Pleasant St
- 243 Oak Grove Ave
Your Personal Tour Guide
Ask me questions while you tour the home.