80 Quinsigamond Ave Vineyard Haven, MA 02568
Vineyard Haven NeighborhoodEstimated Value: $2,821,000 - $4,741,000
5
Beds
5
Baths
2,335
Sq Ft
$1,719/Sq Ft
Est. Value
About This Home
This home is located at 80 Quinsigamond Ave, Vineyard Haven, MA 02568 and is currently estimated at $4,012,793, approximately $1,718 per square foot. 80 Quinsigamond Ave is a home located in Dukes County with nearby schools including Tisbury Elementary School, Martha's Vineyard Regional High School, and Vineyard Montessori School.
Ownership History
Date
Name
Owned For
Owner Type
Purchase Details
Closed on
Dec 10, 1993
Sold by
Tartt Jo
Bought by
Stinson John T
Current Estimated Value
Home Financials for this Owner
Home Financials are based on the most recent Mortgage that was taken out on this home.
Original Mortgage
$250,000
Interest Rate
6.78%
Mortgage Type
Purchase Money Mortgage
Create a Home Valuation Report for This Property
The Home Valuation Report is an in-depth analysis detailing your home's value as well as a comparison with similar homes in the area
Home Values in the Area
Average Home Value in this Area
Purchase History
| Date | Buyer | Sale Price | Title Company |
|---|---|---|---|
| Stinson John T | $550,000 | -- | |
| Stinson John T | $550,000 | -- |
Source: Public Records
Mortgage History
| Date | Status | Borrower | Loan Amount |
|---|---|---|---|
| Open | Stinson John T | $300,000 | |
| Closed | Stinson John T | $250,000 |
Source: Public Records
Tax History Compared to Growth
Tax History
| Year | Tax Paid | Tax Assessment Tax Assessment Total Assessment is a certain percentage of the fair market value that is determined by local assessors to be the total taxable value of land and additions on the property. | Land | Improvement |
|---|---|---|---|---|
| 2025 | $30,191 | $3,988,300 | $2,164,700 | $1,823,600 |
| 2024 | $23,772 | $2,978,900 | $1,646,300 | $1,332,600 |
| 2023 | $20,764 | $2,836,600 | $1,385,900 | $1,450,700 |
| 2022 | $19,640 | $2,257,507 | $835,307 | $1,422,200 |
| 2021 | $17,495 | $1,907,800 | $835,300 | $1,072,500 |
| 2020 | $17,155 | $1,838,700 | $877,100 | $961,600 |
| 2019 | $17,235 | $1,879,500 | $877,100 | $1,002,400 |
| 2018 | $14,029 | $1,484,500 | $751,800 | $732,700 |
| 2017 | $15,322 | $1,681,900 | $925,700 | $756,200 |
| 2016 | $14,890 | $1,625,600 | $947,300 | $678,300 |
| 2015 | $14,439 | $1,618,700 | $925,300 | $693,400 |
Source: Public Records
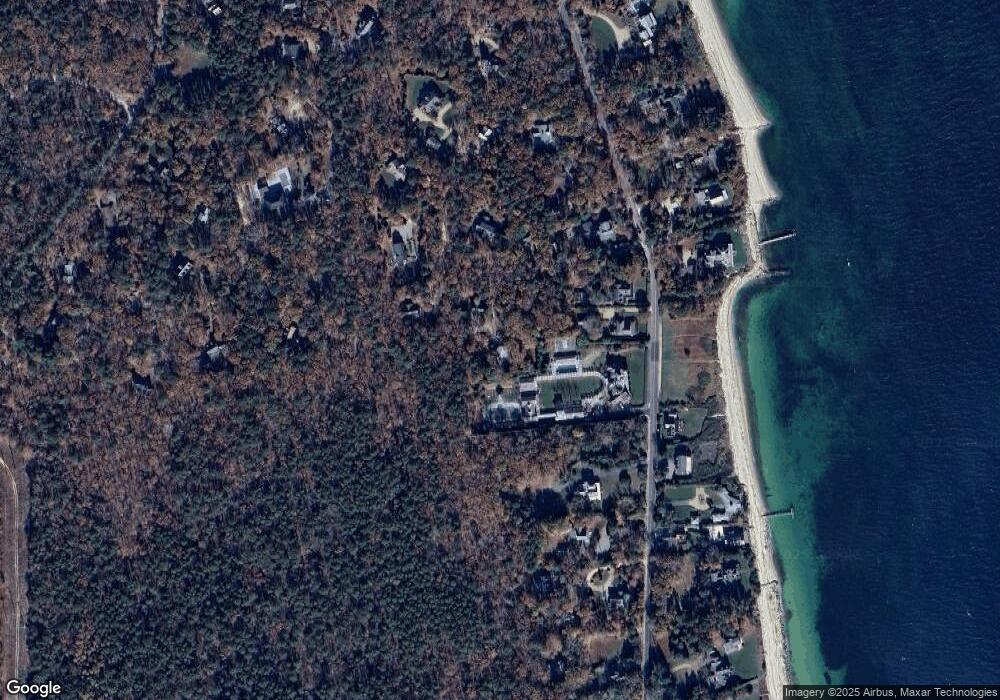
Map
Nearby Homes
- 825 Main St
- 735 Franklin St
- 9 Hagerty Dr
- 41 Crowell Ln
- 63 Crowell Ln
- 5 Pine Tree Ln
- 64 Crowell Ln
- 28 Pine Tree Ln
- 33 Goethals Way
- 113 Leonard Cir
- 22 Old Lighthouse Rd
- 00 Bernard Cir Unit 10
- 22 Clark Ave
- 150 Cove Rd Unit 10
- 185 Sandpiper Ln Unit 12
- 261 Sandpiper Ln Unit 12
- 209 Cove Rd
- 36 Tashmoo Ave
- 151 Tashmoo Ave
- 756 Main St
- 74 Quinsigamond Ave
- 0 Quinsigamond Ave
- 71 Quinsigamond Ave
- 760 Main St
- 764 Main St
- 766 Main St
- 78 Quinsigamond Ave
- 788 Main St
- 806 Main St
- 728 Main St
- 0 Quinsigamond
- 5 Quinsigamond Ave
- 2 Quinsigamond Ave
- 741 Main St
- 814 Main St
- 81 Dudley St
- 718 Main St
- 119 Quinsigamond Ave Vh420
- 733 Main St