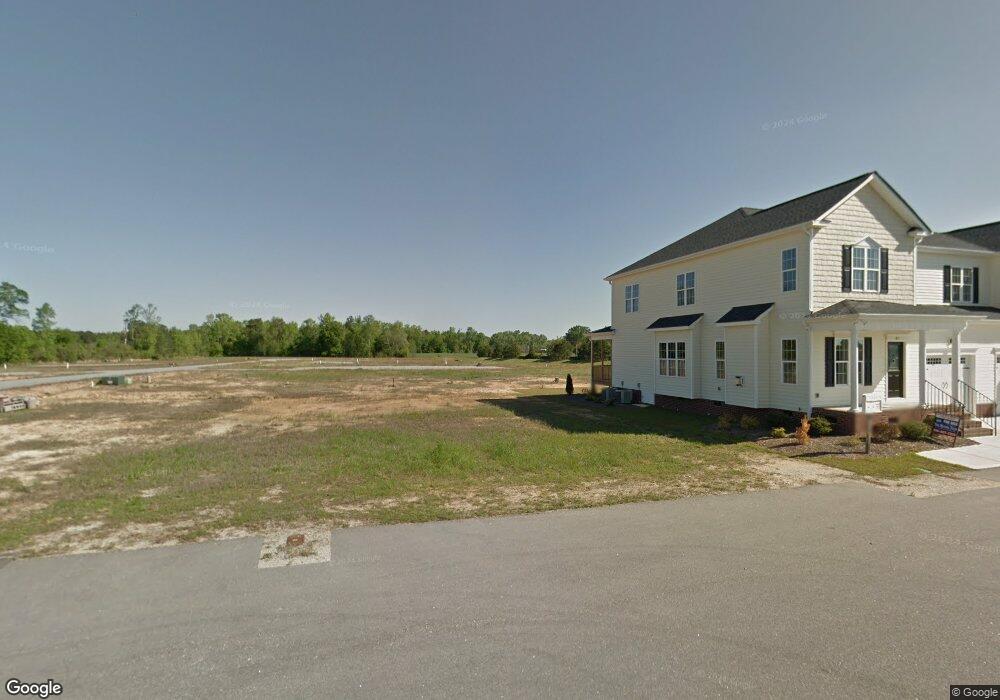
80 Radcliffe Ct Unit L7 Clayton, NC 27527
Wilders NeighborhoodEstimated Value: $359,715 - $370,000
3
Beds
3
Baths
2,018
Sq Ft
$180/Sq Ft
Est. Value
About This Home
This home is located at 80 Radcliffe Ct Unit L7, Clayton, NC 27527 and is currently estimated at $363,679, approximately $180 per square foot. 80 Radcliffe Ct Unit L7 is a home located in Johnston County with nearby schools including River Dell Elementary School, Archer Lodge Middle School, and Corinth Holders High School.
Ownership History
Date
Name
Owned For
Owner Type
Purchase Details
Closed on
Apr 21, 2025
Sold by
Gurley Dennis R and Gurley Tammi
Bought by
Aloisio Paul and Aloisio Giovanna
Current Estimated Value
Purchase Details
Closed on
Nov 19, 2015
Sold by
Curran James J and Curran June
Bought by
Gurley Dennis R
Home Financials for this Owner
Home Financials are based on the most recent Mortgage that was taken out on this home.
Original Mortgage
$190,000
Interest Rate
3.78%
Mortgage Type
New Conventional
Purchase Details
Closed on
Feb 25, 2015
Sold by
Capitol City Homes Llc
Bought by
Curran James J and Curran June
Purchase Details
Closed on
Aug 1, 2014
Sold by
Amaretto Llc
Bought by
Capitol City Homes Llc
Purchase Details
Closed on
Mar 27, 2014
Sold by
Royal Flush Development Llc
Bought by
Amaretto Llc
Create a Home Valuation Report for This Property
The Home Valuation Report is an in-depth analysis detailing your home's value as well as a comparison with similar homes in the area
Home Values in the Area
Average Home Value in this Area
Purchase History
| Date | Buyer | Sale Price | Title Company |
|---|---|---|---|
| Aloisio Paul | $365,000 | None Listed On Document | |
| Gurley Dennis R | $200,000 | None Available | |
| Curran James J | $198,000 | None Available | |
| Capitol City Homes Llc | $216,000 | None Available | |
| Amaretto Llc | -- | None Available | |
| Amaretto Llc | $1,200,000 | None Available |
Source: Public Records
Mortgage History
| Date | Status | Borrower | Loan Amount |
|---|---|---|---|
| Previous Owner | Gurley Dennis R | $190,000 |
Source: Public Records
Tax History Compared to Growth
Tax History
| Year | Tax Paid | Tax Assessment Tax Assessment Total Assessment is a certain percentage of the fair market value that is determined by local assessors to be the total taxable value of land and additions on the property. | Land | Improvement |
|---|---|---|---|---|
| 2025 | $2,317 | $364,930 | $50,000 | $314,930 |
| 2024 | $1,919 | $236,970 | $32,500 | $204,470 |
| 2023 | $1,919 | $236,970 | $32,500 | $204,470 |
| 2022 | $1,943 | $236,970 | $32,500 | $204,470 |
| 2021 | $1,943 | $236,970 | $32,500 | $204,470 |
| 2020 | $2,014 | $236,970 | $32,500 | $204,470 |
| 2019 | $2,014 | $236,970 | $32,500 | $204,470 |
| 2018 | $1,629 | $187,290 | $32,500 | $154,790 |
| 2017 | $1,592 | $187,290 | $32,500 | $154,790 |
| 2016 | $1,573 | $185,000 | $32,500 | $152,500 |
| 2015 | -- | $185,000 | $32,500 | $152,500 |
| 2014 | -- | $32,500 | $32,500 | $0 |
Source: Public Records
Map
Nearby Homes
- 78 Radcliffe Ct
- 68 Radcliffe Ct
- 270 Wembley Dr
- 2276 Castleberry Rd
- 459 Windgate Dr
- 347 Manchester Trail
- 69 Cedar Grove Ct
- 323 Windgate Dr
- 260 Ainsley Ct
- 312 S Kramer Path
- 291 Wilshire Way
- 109 Manchester Trail
- 92 Summer Mist Ln Unit 164p
- 41 Capstone Dr
- 80 Summer Mist Ln
- 80 Summer Mist Ln Unit 165p
- 62 Summer Mist Ln Unit 167
- 478 Curling Creek Dr
- 115 Arundel Dr
- 113 Arundel Dr
- 82 Radcliffe Ct
- 78 Radcliffe Ct Unit L8
- 84 Radcliffe Ct
- 70 Radcliffe Ct
- 90 Radcliffe Ct Unit L10 LKC
- 90 Radcliffe Ct
- 72 Radcliffe Ct
- 92 Radcliffe Ct Unit L11 LKC
- 88 Radcliffe Ct Unit L9 LKC
- 88 Radcliffe Ct
- 94 Radcliffe Ct Unit L12 LKC
- 94 Radcliffe Ct
- 77 Radcliffe Ct Unit L41 LKC
- 74 Radcliffe Ct
- 79 Radcliffe Ct
- 79 Radcliffe Ct Unit L42 LKC
- 91 Radcliffe Ct
- 91 Radcliffe Ct Unit L40 LKC
- 81 Radcliffe Ct Unit L43 LKC
- 81 Radcliffe Ct