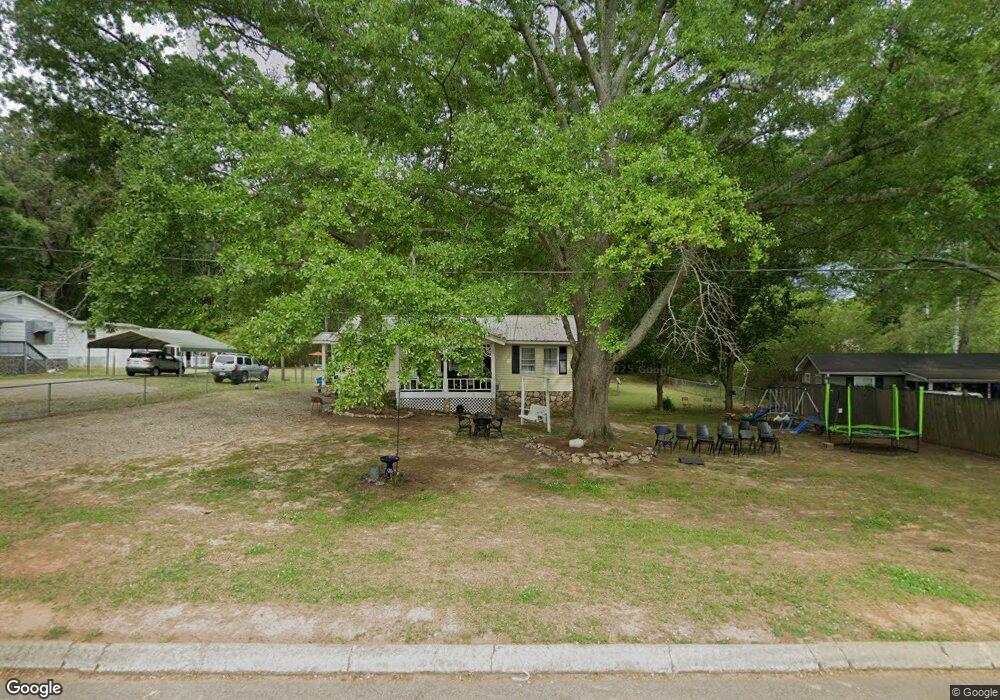
80 Richardson St Griffin, GA 30223
Spalding County NeighborhoodEstimated Value: $119,865 - $174,000
3
Beds
1
Bath
1,088
Sq Ft
$137/Sq Ft
Est. Value
About This Home
This home is located at 80 Richardson St, Griffin, GA 30223 and is currently estimated at $149,466, approximately $137 per square foot. 80 Richardson St is a home located in Spalding County with nearby schools including Jordan Hill Road Elementary School, Kennedy Road Middle School, and Griffin High School.
Ownership History
Date
Name
Owned For
Owner Type
Purchase Details
Closed on
May 6, 2024
Sold by
Shiflett Tammy
Bought by
Dean Amy M
Current Estimated Value
Purchase Details
Closed on
Dec 31, 1997
Sold by
Anderson Jack C and Anderson Dolly
Bought by
Shiflett Tammy and Kempson Barbara
Home Financials for this Owner
Home Financials are based on the most recent Mortgage that was taken out on this home.
Original Mortgage
$63,600
Interest Rate
7.2%
Mortgage Type
New Conventional
Purchase Details
Closed on
Mar 30, 1973
Sold by
Starr Ruby Mcchargue and Benjamin Earl
Bought by
Anderson Jack Carl
Purchase Details
Closed on
Mar 4, 1967
Sold by
Starr Ruby Dickens
Bought by
Mcchargue Starr Ruby and Earl Benjamin
Purchase Details
Closed on
Jan 1, 1967
Sold by
Dickens Ruby Mcchargue
Bought by
Starr Ruby Mcchargue
Purchase Details
Closed on
Nov 16, 1966
Sold by
Dickens George A and Ruby Milner
Bought by
Dickens Ruby Mcchargue
Purchase Details
Closed on
Feb 10, 1962
Bought by
Dickens George A and Ruby Milner
Create a Home Valuation Report for This Property
The Home Valuation Report is an in-depth analysis detailing your home's value as well as a comparison with similar homes in the area
Home Values in the Area
Average Home Value in this Area
Purchase History
| Date | Buyer | Sale Price | Title Company |
|---|---|---|---|
| Dean Amy M | -- | -- | |
| Shiflett Tammy | $67,000 | -- | |
| Anderson Jack Carl | $9,000 | -- | |
| Mcchargue Starr Ruby | -- | -- | |
| Mcchargue Starr Ruby | -- | -- | |
| Starr Ruby Mcchargue | -- | -- | |
| Dickens Ruby Mcchargue | $600 | -- | |
| Dickens George A | -- | -- |
Source: Public Records
Mortgage History
| Date | Status | Borrower | Loan Amount |
|---|---|---|---|
| Previous Owner | Shiflett Tammy | $63,600 |
Source: Public Records
Tax History Compared to Growth
Tax History
| Year | Tax Paid | Tax Assessment Tax Assessment Total Assessment is a certain percentage of the fair market value that is determined by local assessors to be the total taxable value of land and additions on the property. | Land | Improvement |
|---|---|---|---|---|
| 2024 | $634 | $19,507 | $5,600 | $13,907 |
| 2023 | $644 | $19,507 | $5,600 | $13,907 |
| 2022 | $564 | $17,331 | $4,800 | $12,531 |
| 2021 | $472 | $14,776 | $3,600 | $11,176 |
| 2020 | $428 | $13,543 | $3,600 | $9,943 |
| 2019 | $437 | $13,543 | $3,600 | $9,943 |
| 2018 | $414 | $12,637 | $3,600 | $9,037 |
| 2017 | $403 | $12,637 | $3,600 | $9,037 |
| 2016 | $410 | $12,637 | $3,600 | $9,037 |
| 2015 | $423 | $12,637 | $3,600 | $9,037 |
| 2014 | $431 | $12,637 | $3,600 | $9,037 |
Source: Public Records
Map
Nearby Homes
- 111 Vineyard Rd
- 2407 Old Atlanta Rd
- 205 Westmoreland Dr
- 304 Kilgore Rd
- 310 Sunset Dr
- 1757 Pineview Rd
- 130 N Morgan Dr
- 1548 Fleetwood Dr
- 1205 Chardonnay Ln
- 0 Jackson Rd Unit 10545729
- 101 Front St
- 339 Main St
- 230 Manley Rd
- 208 Tyler Trace
- 111 Patterson Rd
- 441 Hickory Ln
- 200,210 Highland Ave
- 436 Lakeview St
- 206 Elizabeth St
- 114 Woodcrest Dr
- 70 Richardson St
- 90 Richardson St
- 60 Richardson St
- 96 Richardson St
- 59 Richardson St
- 0 Richardson St Unit 7039394
- 0 Richardson St
- 89 Richardson St
- 50 Richardson St
- 100 Richardson St
- 93 Richardson St
- 41 Richardson St
- 30 Richardson St
- 95 Richardson St
- 121 Dobbins Cir
- 119 Dobbins Cir
- 99 Richardson St
- 146 Kilgore Rd
- 572 Kilgore Rd
- 592 Kilgore Rd