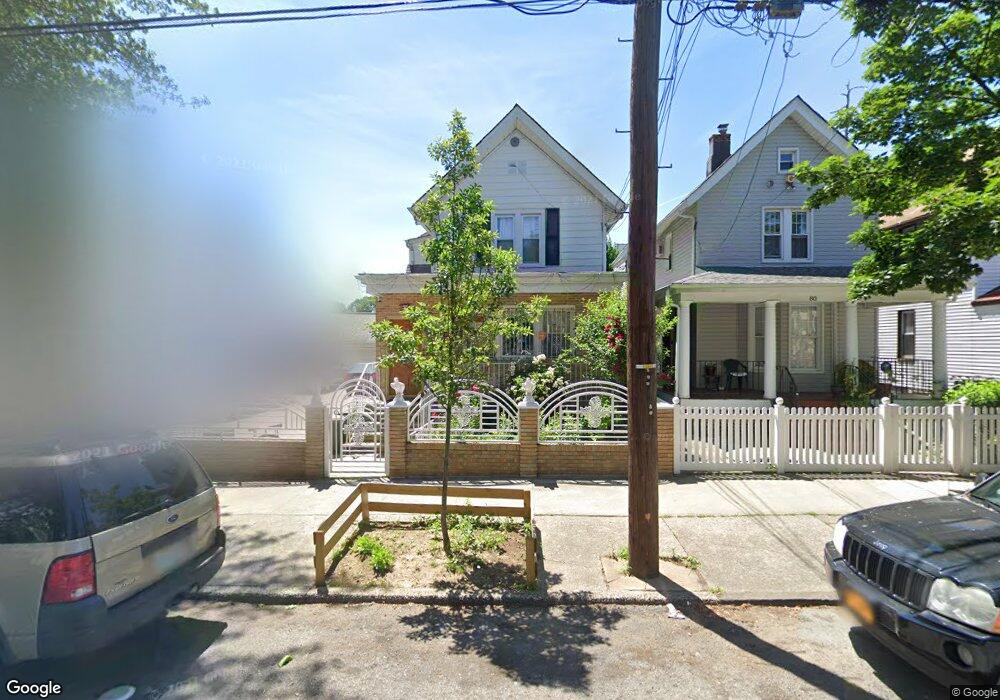
80 Richmond St Brooklyn, NY 11208
Cypress Hills NeighborhoodEstimated Value: $831,289 - $1,004,000
Studio
--
Bath
1,740
Sq Ft
$514/Sq Ft
Est. Value
About This Home
This home is located at 80 Richmond St, Brooklyn, NY 11208 and is currently estimated at $894,572, approximately $514 per square foot. 80 Richmond St is a home located in Kings County with nearby schools including P.S. 65, Is 171 Abraham Lincoln, and Blessed Sacrament School.
Ownership History
Date
Name
Owned For
Owner Type
Purchase Details
Closed on
Oct 6, 2023
Sold by
Stango Michael A
Bought by
Christopher M. Stango and The Michael A Stango Irrevocable Trust
Current Estimated Value
Purchase Details
Closed on
Oct 17, 2013
Sold by
Nobile Barbara J and Parisi Diane M
Bought by
Stango Michael A
Home Financials for this Owner
Home Financials are based on the most recent Mortgage that was taken out on this home.
Original Mortgage
$517,500
Outstanding Balance
$508,520
Interest Rate
4.52%
Mortgage Type
Reverse Mortgage Home Equity Conversion Mortgage
Estimated Equity
$386,052
Purchase Details
Closed on
Jan 17, 2000
Sold by
Stango Domenic J and Stango Christina
Bought by
Parisi Diane M and Stango Michael A
Create a Home Valuation Report for This Property
The Home Valuation Report is an in-depth analysis detailing your home's value as well as a comparison with similar homes in the area
Home Values in the Area
Average Home Value in this Area
Purchase History
| Date | Buyer | Sale Price | Title Company |
|---|---|---|---|
| Christopher M. Stango | -- | -- | |
| Christopher M. Stango | -- | -- | |
| Christopher M. Stango | -- | -- | |
| Stango Michael A | $264,000 | -- | |
| Stango Michael A | $264,000 | -- | |
| Parisi Diane M | -- | First American Title Ins Co | |
| Parisi Diane M | -- | First American Title Ins Co |
Source: Public Records
Mortgage History
| Date | Status | Borrower | Loan Amount |
|---|---|---|---|
| Open | Stango Michael A | $517,500 | |
| Closed | Stango Michael A | $517,500 |
Source: Public Records
Tax History
| Year | Tax Paid | Tax Assessment Tax Assessment Total Assessment is a certain percentage of the fair market value that is determined by local assessors to be the total taxable value of land and additions on the property. | Land | Improvement |
|---|---|---|---|---|
| 2025 | $4,224 | $44,280 | $15,960 | $28,320 |
| 2024 | $4,224 | $52,080 | $15,960 | $36,120 |
| 2023 | $2,015 | $51,900 | $15,960 | $35,940 |
| 2022 | $1,870 | $46,680 | $15,960 | $30,720 |
| 2021 | $1,862 | $39,420 | $15,960 | $23,460 |
| 2020 | $924 | $33,900 | $15,960 | $17,940 |
| 2019 | $1,833 | $33,900 | $15,960 | $17,940 |
| 2018 | $1,686 | $16,539 | $6,972 | $9,567 |
| 2017 | $1,591 | $15,614 | $7,972 | $7,642 |
| 2016 | $2,948 | $14,748 | $6,894 | $7,854 |
| 2015 | $1,093 | $14,727 | $8,812 | $5,915 |
| 2014 | $1,093 | $14,604 | $10,482 | $4,122 |
Source: Public Records
Map
Nearby Homes
Your Personal Tour Guide
Ask me questions while you tour the home.