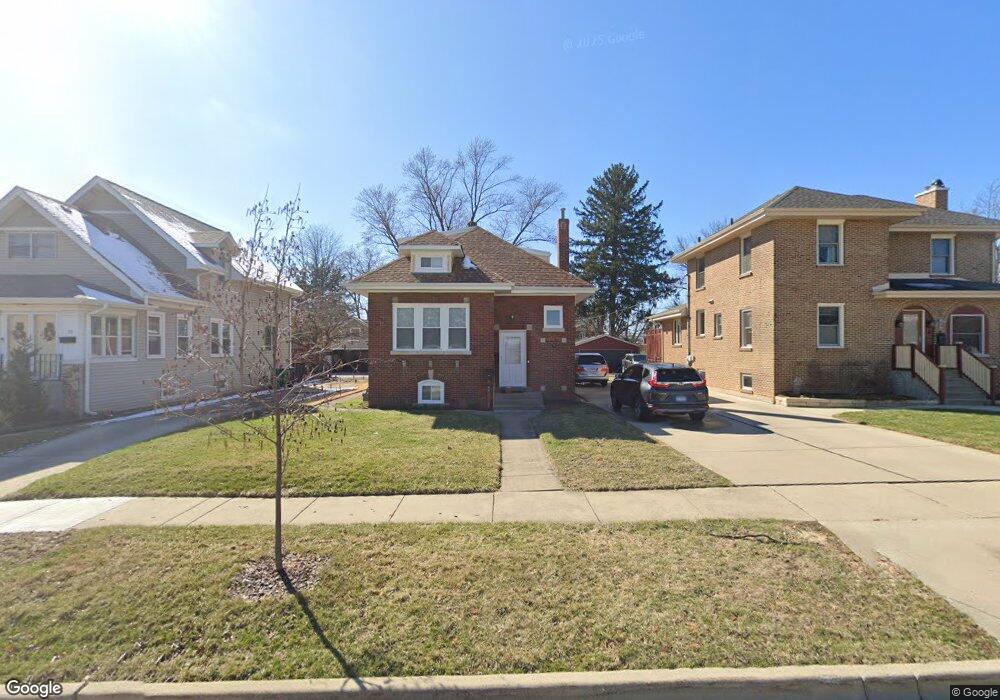
80 S Grace St Unit 1 Lombard, IL 60148
North Lombard NeighborhoodEstimated Value: $382,000 - $509,000
4
Beds
2
Baths
1,614
Sq Ft
$291/Sq Ft
Est. Value
About This Home
This home is located at 80 S Grace St Unit 1, Lombard, IL 60148 and is currently estimated at $468,962, approximately $290 per square foot. 80 S Grace St Unit 1 is a home located in DuPage County with nearby schools including Pleasant Lane Elementary School, Park View Elementary School, and Madison Elementary School.
Ownership History
Date
Name
Owned For
Owner Type
Purchase Details
Closed on
Jul 7, 2023
Sold by
Beach View Llc
Bought by
Miller Nicholas C and Miller Alison N
Current Estimated Value
Home Financials for this Owner
Home Financials are based on the most recent Mortgage that was taken out on this home.
Original Mortgage
$412,250
Outstanding Balance
$403,020
Interest Rate
7.13%
Mortgage Type
New Conventional
Estimated Equity
$65,942
Purchase Details
Closed on
Oct 3, 2022
Sold by
Grandview Capital Llc
Bought by
Beach View Llc
Purchase Details
Closed on
Mar 2, 2021
Sold by
Hunter Donald G
Bought by
Hunter Donald G and Donald G Hunter Revocable Trust
Purchase Details
Closed on
Aug 2, 2003
Sold by
Donald G Hunter Revocable Trust
Bought by
Grandview Capital Llc
Home Financials for this Owner
Home Financials are based on the most recent Mortgage that was taken out on this home.
Original Mortgage
$131,250
Interest Rate
5.5%
Mortgage Type
Construction
Create a Home Valuation Report for This Property
The Home Valuation Report is an in-depth analysis detailing your home's value as well as a comparison with similar homes in the area
Home Values in the Area
Average Home Value in this Area
Purchase History
| Date | Buyer | Sale Price | Title Company |
|---|---|---|---|
| Miller Nicholas C | $425,000 | John Greene Title Services Llc | |
| Beach View Llc | $245,000 | -- | |
| Hunter Donald G | -- | None Available | |
| Grandview Capital Llc | $175,000 | Chicago Title Insurance Co |
Source: Public Records
Mortgage History
| Date | Status | Borrower | Loan Amount |
|---|---|---|---|
| Open | Miller Nicholas C | $412,250 | |
| Previous Owner | Grandview Capital Llc | $131,250 |
Source: Public Records
Tax History Compared to Growth
Tax History
| Year | Tax Paid | Tax Assessment Tax Assessment Total Assessment is a certain percentage of the fair market value that is determined by local assessors to be the total taxable value of land and additions on the property. | Land | Improvement |
|---|---|---|---|---|
| 2024 | $8,668 | $119,560 | $21,509 | $98,051 |
| 2023 | $8,247 | $110,560 | $19,890 | $90,670 |
| 2022 | $7,603 | $106,280 | $19,120 | $87,160 |
| 2021 | $7,354 | $103,630 | $18,640 | $84,990 |
| 2020 | $7,191 | $101,360 | $18,230 | $83,130 |
| 2019 | $6,811 | $96,370 | $17,330 | $79,040 |
| 2018 | $6,896 | $94,090 | $22,350 | $71,740 |
| 2017 | $6,681 | $89,660 | $21,300 | $68,360 |
| 2016 | $6,471 | $84,470 | $20,070 | $64,400 |
| 2015 | $6,082 | $78,700 | $18,700 | $60,000 |
| 2014 | $6,065 | $76,540 | $23,290 | $53,250 |
| 2013 | $5,979 | $77,620 | $23,620 | $54,000 |
Source: Public Records
Map
Nearby Homes
- 190 S Grace St
- 405 E Prairie Ave
- 201 N Stewart Ave
- 107 S Charlotte St
- 105 E Grove St
- 634 E Emerson Ave
- 313 S Lombard Ave
- 216 S Edgewood Ave
- 82 S Lodge Ln
- 252 N Lombard Ave
- 220 N Martha St
- 328 S Grace St
- 25 E Parkside Ave
- 33 N Main St Unit 11A
- 125 S Chase Ave
- 260 N Charlotte St
- 736 E Saint Charles Rd
- 118 S Highland Ave
- 49 Orchard Terrace Unit 1
- 373 N Lombard Ave
- 80 S Grace St
- 90 S Grace St
- 70 S Grace St
- 94 S Grace St
- 66 S Grace St
- 102 S Grace St
- 63 S Lombard Ave
- 71 S Lombard Ave
- 77 S Lombard Ave
- 53 S Lombard Ave
- 349 E Parkside Ave
- 343 E Parkside Ave
- 45 S Lombard Ave
- 110 S Grace St
- 85 S Lombard Ave
- 339 E Parkside Ave
- 93 S Lombard Ave
- 33 S Lombard Ave
- 99 S Lombard Ave
- 116 S Grace St