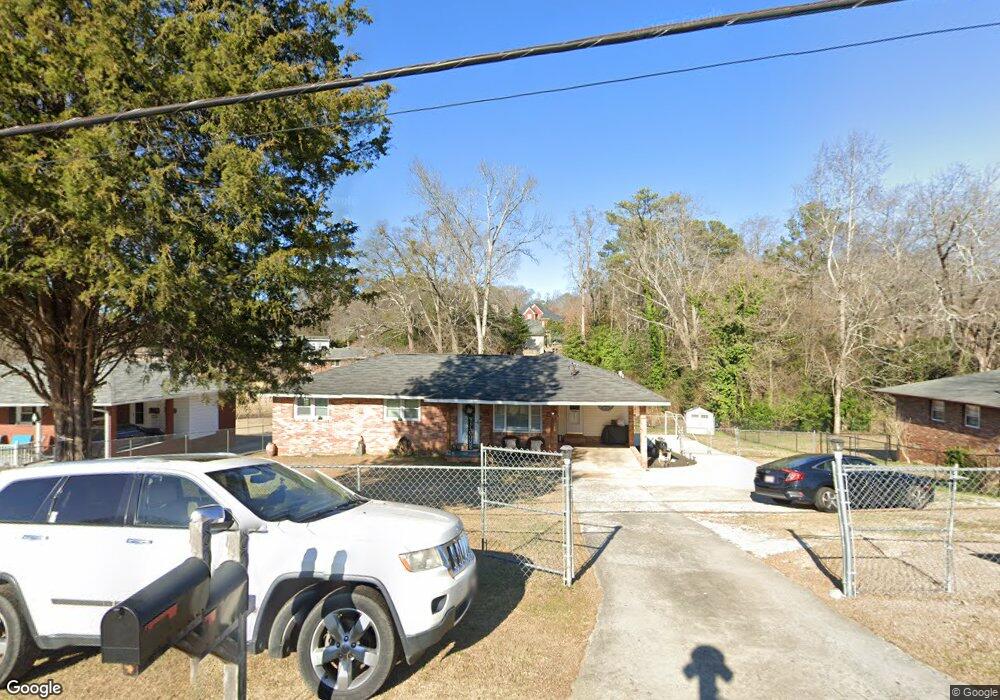
80 Sheraton Way SW Mableton, GA 30126
Estimated Value: $265,000 - $287,000
4
Beds
3
Baths
1,581
Sq Ft
$174/Sq Ft
Est. Value
About This Home
This home is located at 80 Sheraton Way SW, Mableton, GA 30126 and is currently estimated at $274,679, approximately $173 per square foot. 80 Sheraton Way SW is a home located in Cobb County with nearby schools including Clay-Harmony Leland Elementary School, Lindley Middle School, and Pebblebrook High School.
Ownership History
Date
Name
Owned For
Owner Type
Purchase Details
Closed on
May 13, 2005
Sold by
Hilario Anselmo
Bought by
Hilario Anselmo and Hilario Sandra
Current Estimated Value
Purchase Details
Closed on
Feb 23, 2000
Sold by
Montalvo Osvaldo and Montalvo Lisa I
Bought by
Hilario Anselmo
Home Financials for this Owner
Home Financials are based on the most recent Mortgage that was taken out on this home.
Original Mortgage
$92,735
Interest Rate
8.3%
Mortgage Type
FHA
Purchase Details
Closed on
Jul 15, 1993
Sold by
Mendenhall Michael L Melanie
Bought by
Montalvo Osvaldo Liza I
Home Financials for this Owner
Home Financials are based on the most recent Mortgage that was taken out on this home.
Original Mortgage
$71,400
Interest Rate
7.49%
Mortgage Type
FHA
Create a Home Valuation Report for This Property
The Home Valuation Report is an in-depth analysis detailing your home's value as well as a comparison with similar homes in the area
Home Values in the Area
Average Home Value in this Area
Purchase History
| Date | Buyer | Sale Price | Title Company |
|---|---|---|---|
| Hilario Anselmo | -- | -- | |
| Hilario Anselmo | $93,500 | -- | |
| Montalvo Osvaldo Liza I | $72,500 | -- |
Source: Public Records
Mortgage History
| Date | Status | Borrower | Loan Amount |
|---|---|---|---|
| Previous Owner | Hilario Anselmo | $92,735 | |
| Previous Owner | Montalvo Osvaldo Liza I | $71,400 |
Source: Public Records
Tax History Compared to Growth
Tax History
| Year | Tax Paid | Tax Assessment Tax Assessment Total Assessment is a certain percentage of the fair market value that is determined by local assessors to be the total taxable value of land and additions on the property. | Land | Improvement |
|---|---|---|---|---|
| 2025 | $2,459 | $111,492 | $19,800 | $91,692 |
| 2024 | $2,461 | $111,492 | $19,800 | $91,692 |
| 2023 | $1,368 | $86,124 | $14,400 | $71,724 |
| 2022 | $1,693 | $75,500 | $9,000 | $66,500 |
| 2021 | $1,421 | $63,044 | $9,000 | $54,044 |
| 2020 | $1,154 | $50,864 | $9,000 | $41,864 |
| 2019 | $1,028 | $45,128 | $9,000 | $36,128 |
| 2018 | $1,028 | $45,128 | $9,000 | $36,128 |
| 2017 | $616 | $30,364 | $5,400 | $24,964 |
| 2016 | $542 | $27,760 | $4,320 | $23,440 |
| 2015 | $558 | $27,760 | $4,320 | $23,440 |
| 2014 | $298 | $18,868 | $0 | $0 |
Source: Public Records
Map
Nearby Homes
- 6030 Ridge Dr SE
- 6215 Dodgen Rd SW
- 220 Lane Dr
- 5972 Allen Rd SE
- 6286 Allen Rd SW
- 6264 Godfrey Dr SW
- 317 Community Dr SW
- 5859 Lone Oak Dr SW
- 6361 Dodgen Rd SW
- 5675 Coopers Glen Ct SW
- 6213 Honeybell Aly
- 6054 Knickerbocker St
- 6080 Knickerbocker St
- 6247 Honeybell Aly
- 6058 Knickerbocker St
- 5787 Vinings Retreat Way SW
- 5846 Schelton Place SE
- Forsyth Plan at Somerset at Veterans Memorial
- 2740 Byess Ct
- 6305 Mountain Home Way SE
- 86 Sheraton Way SW
- 70 Sheraton Way SW
- 75 Virgil St SW
- 60 Sheraton Way SW
- 63 Virgil St SW
- 85 Sheraton Way SW
- 6030 Wedgewood Dr SE
- 6064 Brookdale Ln SW
- 6031 Wedgewood Dr SE
- 50 Sheraton Way SW
- 55 Virgil St SW
- 99 Virgil St SW
- 89 Sheraton Way SW
- 6035 Wedgewood Dr SE
- 121 Virgil St SW
- 6052 Brookdale Ln SW
- 49 Sheraton Way SW
- 74 Virgil St SW
- 6034 Wedgewood Dr SE
- 6034 Wedgewood Dr SE Unit 31