80 Sue Ann Dr Lampasas, TX 76550
Estimated Value: $241,000 - $288,425
3
Beds
2
Baths
1,682
Sq Ft
$158/Sq Ft
Est. Value
About This Home
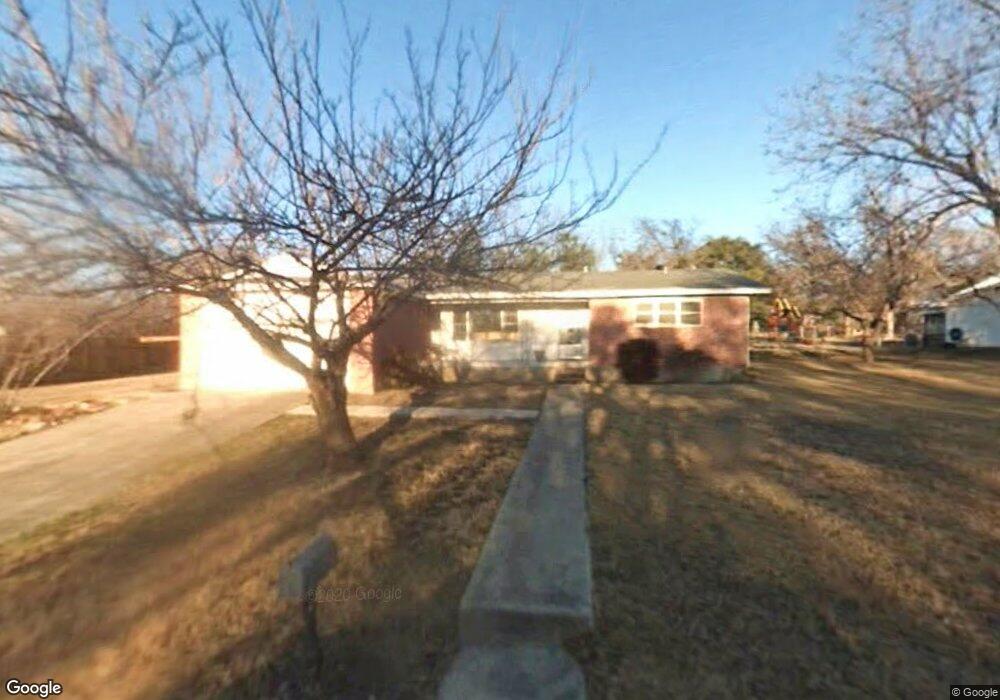
This home is located at 80 Sue Ann Dr, Lampasas, TX 76550 and is currently estimated at $266,106, approximately $158 per square foot. 80 Sue Ann Dr is a home located in Lampasas County with nearby schools including Kline Whitis Elementary School, Lampasas Middle School, and Lampasas High School.
Ownership History
Date
Name
Owned For
Owner Type
Purchase Details
Closed on
Mar 15, 2011
Sold by
Martin Aliece F and Martin Myles Dean
Bought by
Depew Roy W and Depew Jennifer L
Current Estimated Value
Home Financials for this Owner
Home Financials are based on the most recent Mortgage that was taken out on this home.
Original Mortgage
$130,603
Outstanding Balance
$89,568
Interest Rate
4.75%
Mortgage Type
FHA
Estimated Equity
$176,538
Purchase Details
Closed on
Jan 16, 2007
Sold by
Machen Patricia
Bought by
Martin Aliece F
Home Financials for this Owner
Home Financials are based on the most recent Mortgage that was taken out on this home.
Original Mortgage
$82,650
Interest Rate
6.09%
Create a Home Valuation Report for This Property
The Home Valuation Report is an in-depth analysis detailing your home's value as well as a comparison with similar homes in the area
Home Values in the Area
Average Home Value in this Area
Purchase History
| Date | Buyer | Sale Price | Title Company |
|---|---|---|---|
| Depew Roy W | $130,603 | -- | |
| Martin Aliece F | $82,650 | -- |
Source: Public Records
Mortgage History
| Date | Status | Borrower | Loan Amount |
|---|---|---|---|
| Open | Depew Roy W | $130,603 | |
| Previous Owner | Martin Aliece F | $82,650 |
Source: Public Records
Tax History Compared to Growth
Tax History
| Year | Tax Paid | Tax Assessment Tax Assessment Total Assessment is a certain percentage of the fair market value that is determined by local assessors to be the total taxable value of land and additions on the property. | Land | Improvement |
|---|---|---|---|---|
| 2024 | $4,492 | $289,160 | $37,010 | $252,150 |
| 2023 | $3,589 | $291,500 | $31,720 | $259,780 |
| 2022 | $3,720 | $266,840 | $31,720 | $235,120 |
| 2021 | $3,901 | $211,820 | $29,080 | $182,740 |
| 2020 | $3,567 | $146,400 | $26,430 | $119,970 |
| 2019 | $3,605 | $142,910 | $26,430 | $116,480 |
| 2018 | $3,409 | $141,500 | $26,430 | $115,070 |
| 2017 | $2,785 | $111,670 | $26,430 | $85,240 |
| 2016 | $2,547 | $102,120 | $16,880 | $85,240 |
| 2015 | -- | $102,120 | $16,880 | $85,240 |
| 2014 | -- | $99,230 | $16,880 | $82,350 |
Source: Public Records
Map
Nearby Homes