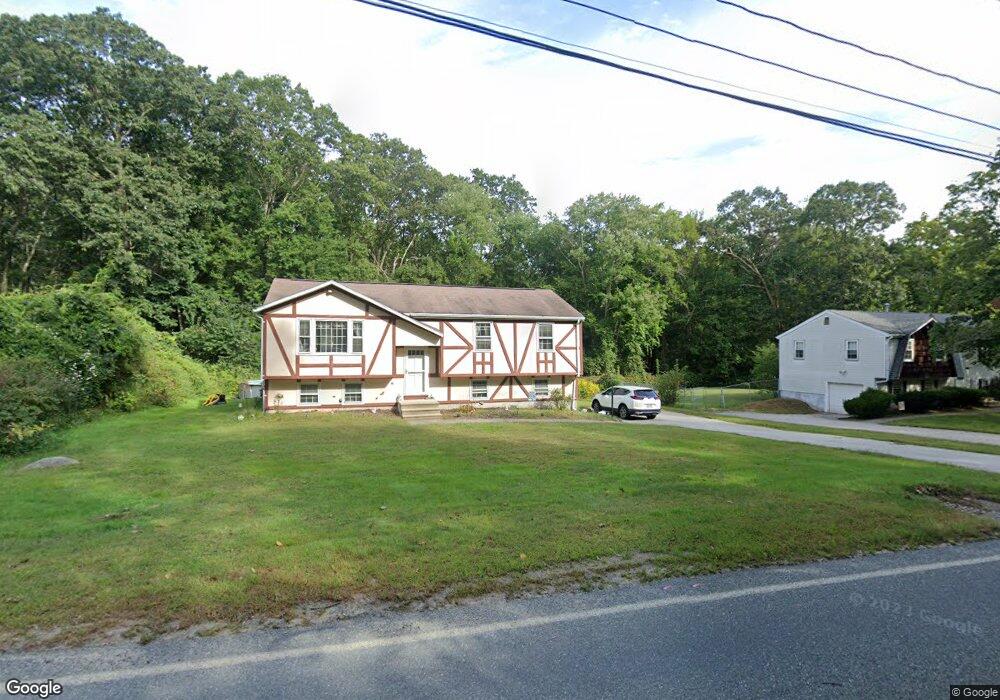
80 Summer St Blackstone, MA 01504
Estimated Value: $416,890 - $525,000
3
Beds
1
Bath
1,044
Sq Ft
$445/Sq Ft
Est. Value
About This Home
This home is located at 80 Summer St, Blackstone, MA 01504 and is currently estimated at $464,223, approximately $444 per square foot. 80 Summer St is a home located in Worcester County with nearby schools including Blackstone-Millville Regional High School, Founders Academy, and Beacon Charter School.
Ownership History
Date
Name
Owned For
Owner Type
Purchase Details
Closed on
Sep 30, 1993
Sold by
Cooper John and Cooper Carol D
Bought by
Lemay Michael and Lemay Tami
Current Estimated Value
Home Financials for this Owner
Home Financials are based on the most recent Mortgage that was taken out on this home.
Original Mortgage
$114,550
Interest Rate
7%
Mortgage Type
Purchase Money Mortgage
Create a Home Valuation Report for This Property
The Home Valuation Report is an in-depth analysis detailing your home's value as well as a comparison with similar homes in the area
Home Values in the Area
Average Home Value in this Area
Purchase History
| Date | Buyer | Sale Price | Title Company |
|---|---|---|---|
| Lemay Michael | $115,000 | -- |
Source: Public Records
Mortgage History
| Date | Status | Borrower | Loan Amount |
|---|---|---|---|
| Open | Lemay Michael | $157,000 | |
| Closed | Lemay Michael | $28,000 | |
| Closed | Lemay Michael | $114,550 | |
| Previous Owner | Lemay Michael | $54,000 |
Source: Public Records
Tax History
| Year | Tax Paid | Tax Assessment Tax Assessment Total Assessment is a certain percentage of the fair market value that is determined by local assessors to be the total taxable value of land and additions on the property. | Land | Improvement |
|---|---|---|---|---|
| 2025 | $5,306 | $351,400 | $170,600 | $180,800 |
| 2024 | $5,382 | $329,600 | $179,100 | $150,500 |
| 2023 | $5,302 | $327,700 | $179,100 | $148,600 |
| 2022 | $4,831 | $269,900 | $162,800 | $107,100 |
| 2021 | $3,808 | $234,300 | $147,700 | $86,600 |
| 2020 | $7,336 | $243,100 | $147,700 | $95,400 |
| 2019 | $4,546 | $240,400 | $136,300 | $104,100 |
| 2018 | $5,760 | $222,800 | $129,000 | $93,800 |
| 2017 | $4,251 | $220,700 | $129,000 | $91,700 |
| 2016 | $4,342 | $224,500 | $120,600 | $103,900 |
| 2015 | $4,208 | $216,000 | $120,600 | $95,400 |
Source: Public Records
Map
Nearby Homes
- 162 Blackstone St
- 1, 3, 5 Old Lincoln St
- Lot 3 Pickering Rd
- Lot 2 Pickering Rd
- Lot 1 Pickering Rd
- Lot 4 Pickering Rd
- Lot 5 Pickering Rd
- 183 Elm St Unit 185
- 44 Federal St
- 22 Fox Run Rd
- 183-183R Mendon St
- 13 Dawes St
- 27 Liberty Hill Dr
- 76 Main St
- 11 Federal St
- 284 Lincoln St
- 12 Market St
- 10 Huntington Ave
- 60 Fairlawn Ave
- 122 Canal St
Your Personal Tour Guide
Ask me questions while you tour the home.