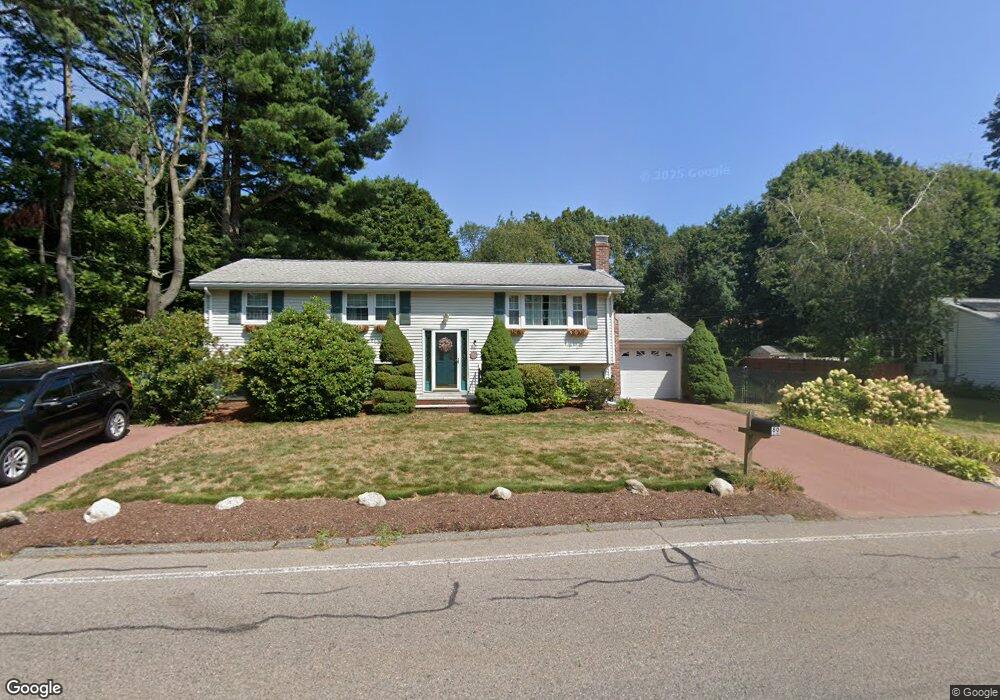
80 Sycamore St Holbrook, MA 02343
Estimated Value: $634,538 - $649,000
3
Beds
3
Baths
1,977
Sq Ft
$325/Sq Ft
Est. Value
About This Home
This home is located at 80 Sycamore St, Holbrook, MA 02343 and is currently estimated at $643,385, approximately $325 per square foot. 80 Sycamore St is a home located in Norfolk County with nearby schools including John F. Kennedy Elementary School, Holbrook Middle High School, and Boston Higashi School.
Ownership History
Date
Name
Owned For
Owner Type
Purchase Details
Closed on
Jan 18, 2001
Sold by
Johnson Stanley R and Johnson Virginia M
Bought by
Odonnell Maureen A
Current Estimated Value
Home Financials for this Owner
Home Financials are based on the most recent Mortgage that was taken out on this home.
Original Mortgage
$175,000
Outstanding Balance
$64,475
Interest Rate
7.52%
Mortgage Type
Purchase Money Mortgage
Estimated Equity
$578,910
Create a Home Valuation Report for This Property
The Home Valuation Report is an in-depth analysis detailing your home's value as well as a comparison with similar homes in the area
Home Values in the Area
Average Home Value in this Area
Purchase History
| Date | Buyer | Sale Price | Title Company |
|---|---|---|---|
| Odonnell Maureen A | $200,000 | -- |
Source: Public Records
Mortgage History
| Date | Status | Borrower | Loan Amount |
|---|---|---|---|
| Open | Odonnell Maureen A | $35,000 | |
| Open | Odonnell Maureen A | $175,000 |
Source: Public Records
Tax History Compared to Growth
Tax History
| Year | Tax Paid | Tax Assessment Tax Assessment Total Assessment is a certain percentage of the fair market value that is determined by local assessors to be the total taxable value of land and additions on the property. | Land | Improvement |
|---|---|---|---|---|
| 2025 | $72 | $545,600 | $256,400 | $289,200 |
| 2024 | $6,643 | $494,300 | $221,400 | $272,900 |
| 2023 | $7,227 | $469,900 | $211,900 | $258,000 |
| 2022 | $6,802 | $412,500 | $180,700 | $231,800 |
| 2021 | $6,702 | $389,200 | $168,800 | $220,400 |
| 2020 | $6,817 | $371,100 | $155,700 | $215,400 |
| 2019 | $6,838 | $351,400 | $148,300 | $203,100 |
| 2018 | $6,569 | $317,800 | $121,200 | $196,600 |
| 2017 | $6,044 | $289,200 | $110,200 | $179,000 |
| 2016 | $5,574 | $283,800 | $108,200 | $175,600 |
| 2015 | $5,144 | $269,600 | $100,200 | $169,400 |
| 2014 | $4,944 | $263,400 | $100,200 | $163,200 |
Source: Public Records
Map
Nearby Homes
- 71 Stevens Dr
- 169 Pond St
- 22 Medallion Rd
- 45-R Ernest St
- 16 Loud Rd
- 278 Sycamore St
- 148 N Franklin St
- 181 S Franklin St Unit 102
- 181 S Franklin St Unit 207
- 152 S Franklin St
- 27 Arnold St
- 19 Bradford St
- 373 N Franklin St
- 27 Winter St
- 6 E Division St
- 129 Albee Dr
- 16 Woodcliff Rd
- 1696 Liberty St
- 375 S Franklin St Unit 1
- 44 Livoli Ave