Estimated Value: $183,000 - $236,000
2
Beds
2
Baths
984
Sq Ft
$219/Sq Ft
Est. Value
About This Home
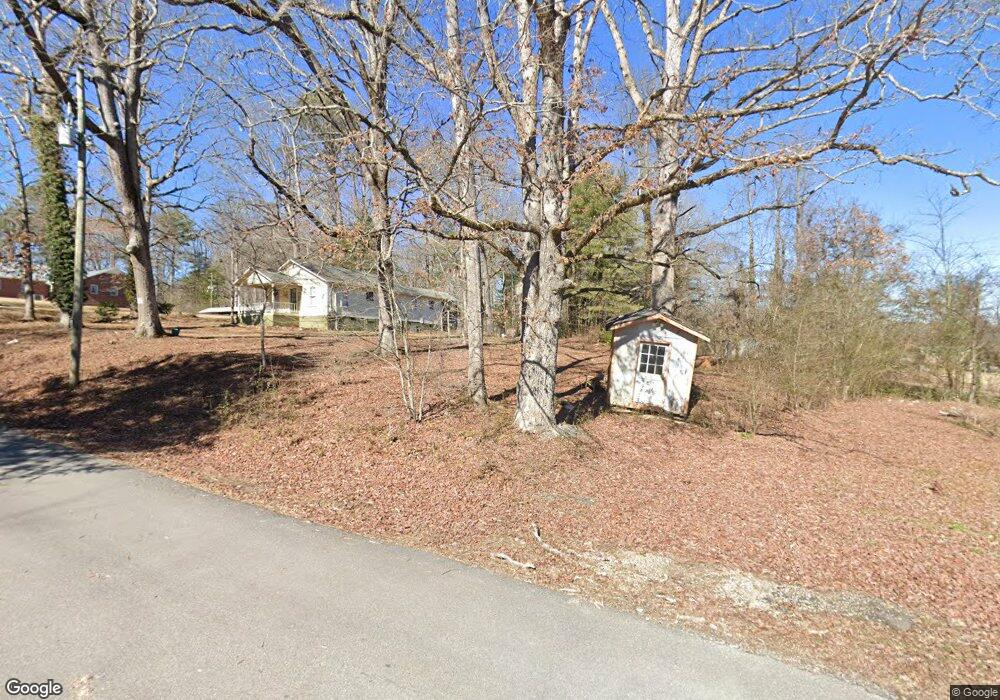
This home is located at 80 Thomas St, Tiger, GA 30576 and is currently estimated at $215,230, approximately $218 per square foot. 80 Thomas St is a home located in Rabun County with nearby schools including Rabun County Primary School and Rabun County High School.
Ownership History
Date
Name
Owned For
Owner Type
Purchase Details
Closed on
Sep 28, 2023
Sold by
Vanderstelt L Renee
Bought by
Quillian John E and Simpson Katie R
Current Estimated Value
Purchase Details
Closed on
Sep 27, 2011
Sold by
Federal Home Loan
Bought by
Vanderstelt L Renee
Purchase Details
Closed on
Aug 2, 2011
Sold by
Stephens Federal Bank
Bought by
Federal Home Loan
Purchase Details
Closed on
Dec 29, 2008
Sold by
Not Provided
Bought by
Kay Carol A
Home Financials for this Owner
Home Financials are based on the most recent Mortgage that was taken out on this home.
Original Mortgage
$100,500
Interest Rate
5.95%
Mortgage Type
New Conventional
Purchase Details
Closed on
Feb 1, 1998
Bought by
Barnes R Renee
Purchase Details
Closed on
Nov 1, 1994
Purchase Details
Closed on
Jun 1, 1988
Create a Home Valuation Report for This Property
The Home Valuation Report is an in-depth analysis detailing your home's value as well as a comparison with similar homes in the area
Home Values in the Area
Average Home Value in this Area
Purchase History
| Date | Buyer | Sale Price | Title Company |
|---|---|---|---|
| Quillian John E | $172,500 | -- | |
| Vanderstelt L Renee | $52,100 | -- | |
| Vanderstelt L Renee | $52,100 | -- | |
| Federal Home Loan | $100,892 | -- | |
| Stephens Federal Bank | $100,892 | -- | |
| Federal Home Loan | $100,892 | -- | |
| Stephens Federal Bank | $100,892 | -- | |
| Kay Carol A | $125,700 | -- | |
| Kay Carol A | $125,700 | -- | |
| Barnes R Renee | $63,500 | -- | |
| Barnes R Renee | $63,500 | -- | |
| -- | $42,000 | -- | |
| -- | $42,000 | -- | |
| -- | $33,000 | -- | |
| -- | $33,000 | -- |
Source: Public Records
Mortgage History
| Date | Status | Borrower | Loan Amount |
|---|---|---|---|
| Previous Owner | Kay Carol A | $100,500 |
Source: Public Records
Tax History
| Year | Tax Paid | Tax Assessment Tax Assessment Total Assessment is a certain percentage of the fair market value that is determined by local assessors to be the total taxable value of land and additions on the property. | Land | Improvement |
|---|---|---|---|---|
| 2025 | $597 | $37,174 | $10,000 | $27,174 |
| 2024 | $752 | $46,866 | $10,000 | $36,866 |
| 2023 | $751 | $41,038 | $10,000 | $31,038 |
| 2022 | $731 | $39,914 | $10,000 | $29,914 |
| 2021 | $681 | $36,320 | $10,000 | $26,320 |
| 2020 | $653 | $33,649 | $10,000 | $23,649 |
| 2019 | $657 | $33,649 | $10,000 | $23,649 |
| 2018 | $660 | $33,649 | $10,000 | $23,649 |
| 2017 | $633 | $33,649 | $10,000 | $23,649 |
| 2016 | $597 | $33,649 | $10,000 | $23,649 |
| 2015 | $570 | $31,613 | $10,000 | $21,613 |
| 2014 | $612 | $31,613 | $10,000 | $21,613 |
Source: Public Records
Map
Nearby Homes
- 211 Blair St
- 813 Tiger Connector
- 0 River Birch Ln Unit LOT 32 10554197
- 191 Applewood Dr
- 63 Redwood Ln
- 38 Old Blue Trail
- 1176 Tiger Pass Dr
- 0 Woodall Rd Unit 10618919
- 14 Big Shoals Trail
- 488 Northridge
- 710 Northridge Dr
- TRACT 3A Big View Ln
- 1063 Joe Davis Rd
- 14 Big Shoals Trail
- 1131 Joe Davis Rd
- 172 Fred Henry Ln
- 0 High Holly Unit 3HH
- 441 Summer Ln
- 9 Golf Dr
- 556 Summer Rd
- 145 N Hudson St
- 3160 Old 441 S
- 47 Thomas St
- 3182 Old 441 S
- 9 N Hudson St
- 26 Bridge Creek Rd
- 82 Bridge Creek Rd
- 3191 Old 441 S
- 7 Arrendale Place
- 0 Covecrest Bonanza NW Unit 3289246
- 0 Covecrest Hollow Unit 3 9053654
- 0 Covecrest Hollow Unit 4 8980415
- 0 Covecrest Hollow Unit 3 8946855
- 0 Covecrest Hollow Unit Lot 4 8913758
- 0 Covecrest Hollow Unit 3 8797665
- 0 Covecrest Hollow Unit 8605892
- 22 Bridgewood Dr
- 79 Bridge Creek Rd
- 3251 Old 441 S
- 25 Bridgewood Dr
Your Personal Tour Guide
Ask me questions while you tour the home.