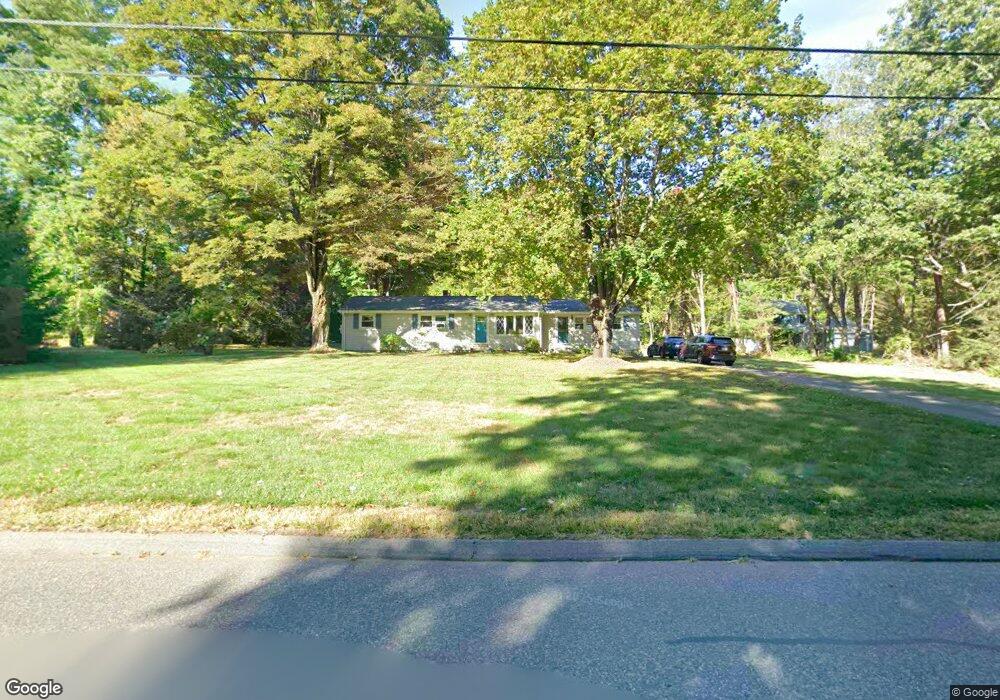
80 Torrey St Easthampton, MA 01027
Estimated Value: $307,000 - $445,000
About This Home
This home is located at 80 Torrey St, Easthampton, MA 01027 and is currently estimated at $378,178, approximately $281 per square foot. 80 Torrey St is a home located in Hampshire County with nearby schools including Easthampton High School, Calvary Baptist Christian School, and The Williston Northampton School.
Ownership History
We collect this data history from publicly available records. To have your information removed, we recommend requesting removal directly through your county’s website.
Purchase Details
Home Financials for this Owner
Home Financials are based on the most recent Mortgage that was taken out on this home.Home Values in the Area
Average Home Value in this Area
Purchase History
We collect this data history from publicly available records. To have your information removed, we recommend requesting removal directly through your county’s website.
| Date | Buyer | Sale Price | Title Company |
|---|---|---|---|
| $103,000 | -- |
Mortgage History
We collect this data history from publicly available records. To have your information removed, we recommend requesting removal directly through your county’s website.
| Date | Status | Borrower | Loan Amount |
|---|---|---|---|
| Open | $90,000 | ||
| Closed | $92,700 | ||
| Previous Owner | $85,000 |
Tax History
We collect this data history from publicly available records. To have your information removed, we recommend requesting removal directly through your county’s website.
| Year | Tax Paid | Tax Assessment Tax Assessment Total Assessment is a certain percentage of the fair market value that is determined by local assessors to be the total taxable value of land and additions on the property. | Land | Improvement |
|---|---|---|---|---|
| 2025 | $4,806 | $351,600 | $135,200 | $216,400 |
| 2024 | $4,638 | $342,000 | $131,200 | $210,800 |
| 2023 | $3,554 | $242,600 | $104,100 | $138,500 |
| 2022 | $4,010 | $242,600 | $104,100 | $138,500 |
| 2021 | $4,376 | $249,500 | $104,100 | $145,400 |
| 2020 | $4,309 | $242,600 | $104,100 | $138,500 |
| 2019 | $3,743 | $242,100 | $104,100 | $138,000 |
| 2018 | $3,587 | $224,200 | $98,000 | $126,200 |
| 2017 | $3,501 | $216,000 | $94,200 | $121,800 |
| 2016 | $3,367 | $216,000 | $94,200 | $121,800 |
| 2015 | $3,272 | $216,000 | $94,200 | $121,800 |
Map
- 36 Torrey St
- 5 Torrey St
- 757 Park Hill Rd
- 45 Glendale Rd
- 16 Steplar Crossing Unit 16
- 1024 Westhampton Rd
- 1260 Westhampton Rd
- 13 Carillon Cir
- 75 Lead Mine Rd
- 1467 Westhampton Rd
- 15 Tiffany Ln
- 0 Westhampton Rd Unit 73526722
- 669 Westhampton Rd
- 0 W Farms Rd
- 422 Park Hill Rd
- 138 West St
- 0 Glendale Rd
- 36 Sovereign Way
- 46 Sovereign Way
- 10 Robin Rd
Ask me questions while you tour the home.