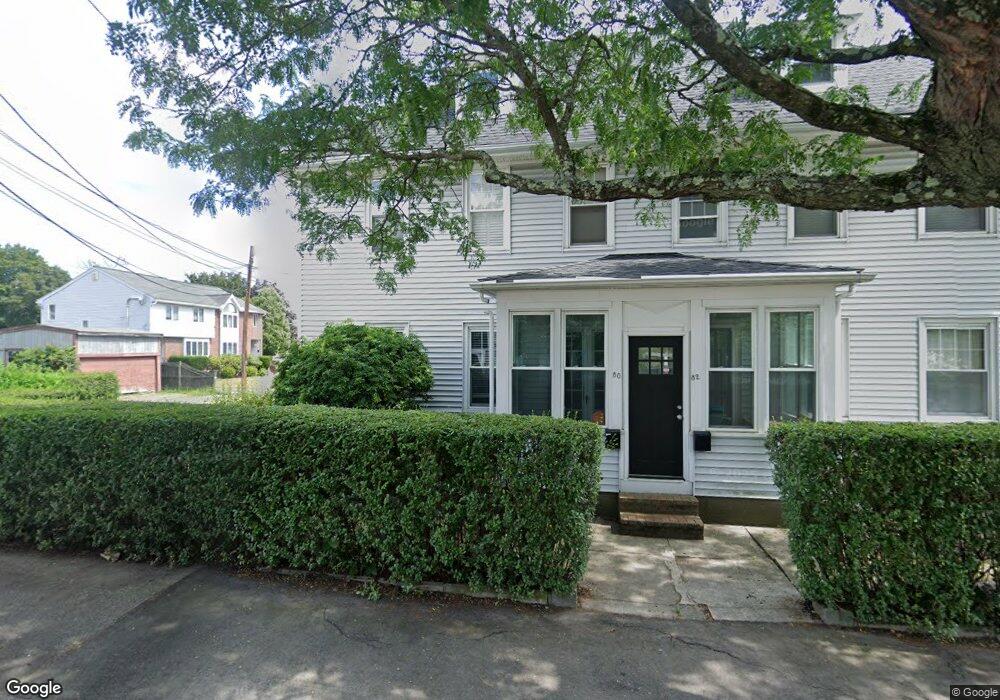
80 Trafford St Unit 2 Quincy, MA 02169
South Quincy NeighborhoodEstimated Value: $519,000 - $590,000
3
Beds
1
Bath
1,144
Sq Ft
$476/Sq Ft
Est. Value
About This Home
This home is located at 80 Trafford St Unit 2, Quincy, MA 02169 and is currently estimated at $544,852, approximately $476 per square foot. 80 Trafford St Unit 2 is a home located in Norfolk County with nearby schools including South West Middle School, Lincoln-Hancock Community School, and Quincy High School.
Ownership History
Date
Name
Owned For
Owner Type
Purchase Details
Closed on
Nov 30, 2006
Sold by
Rizzo Joseph E and Rizzo Sean B
Bought by
Clarke Patrick J
Current Estimated Value
Home Financials for this Owner
Home Financials are based on the most recent Mortgage that was taken out on this home.
Original Mortgage
$230,375
Outstanding Balance
$138,118
Interest Rate
6.36%
Mortgage Type
Purchase Money Mortgage
Estimated Equity
$406,734
Create a Home Valuation Report for This Property
The Home Valuation Report is an in-depth analysis detailing your home's value as well as a comparison with similar homes in the area
Home Values in the Area
Average Home Value in this Area
Purchase History
| Date | Buyer | Sale Price | Title Company |
|---|---|---|---|
| Clarke Patrick J | $242,500 | -- |
Source: Public Records
Mortgage History
| Date | Status | Borrower | Loan Amount |
|---|---|---|---|
| Open | Clarke Patrick J | $230,375 |
Source: Public Records
Tax History Compared to Growth
Tax History
| Year | Tax Paid | Tax Assessment Tax Assessment Total Assessment is a certain percentage of the fair market value that is determined by local assessors to be the total taxable value of land and additions on the property. | Land | Improvement |
|---|---|---|---|---|
| 2025 | $6,318 | $548,000 | $0 | $548,000 |
| 2024 | $6,106 | $541,800 | $0 | $541,800 |
| 2023 | $5,351 | $480,800 | $0 | $480,800 |
| 2022 | $3,624 | $302,500 | $0 | $302,500 |
| 2021 | $3,499 | $288,200 | $0 | $288,200 |
| 2020 | $3,605 | $290,000 | $0 | $290,000 |
| 2019 | $3,493 | $278,300 | $0 | $278,300 |
| 2018 | $3,440 | $257,900 | $0 | $257,900 |
| 2017 | $3,435 | $242,400 | $0 | $242,400 |
| 2016 | $3,298 | $229,700 | $0 | $229,700 |
| 2015 | $3,284 | $224,900 | $0 | $224,900 |
| 2014 | $3,110 | $209,300 | $0 | $209,300 |
Source: Public Records
Map
Nearby Homes
- 347 Centre St
- 21 Totman St Unit 202
- 21 Totman St Unit 309
- 21 Totman St Unit Model-1
- 21 Totman St Unit 209
- 21 Totman St Unit 203
- 21 Totman St Unit 2
- 56 Penn St Unit 4
- 118 Brook Rd Unit 2
- 94 Brook Rd Unit 3
- 72 Federal Ave
- 192 Federal Ave Unit B
- 177 Franklin St
- 51 Brook Rd
- 8 Jackson St Unit B2
- 64 Garfield St Unit B
- 9 Independence Ave Unit 105
- 9 Independence Ave Unit 307
- 91 Garfield St
- 21 Arthur St
- 80 Trafford St Unit 1
- 7 Plain St
- 86 Trafford St
- 79 Trafford St
- 75 Trafford St
- 68 Trafford St
- 8 Plain St
- 8 Plain St Unit A
- 10 Plain St
- 10 Plain St Unit 10
- 10 Plain St
- 10 Plain St Unit 1
- 69 Trafford St
- 89 Trafford St
- 207 Liberty St
- 213 Liberty St
- 95 Trafford St
- 65 Trafford St
- 72 Rodman St
- 197 Liberty St