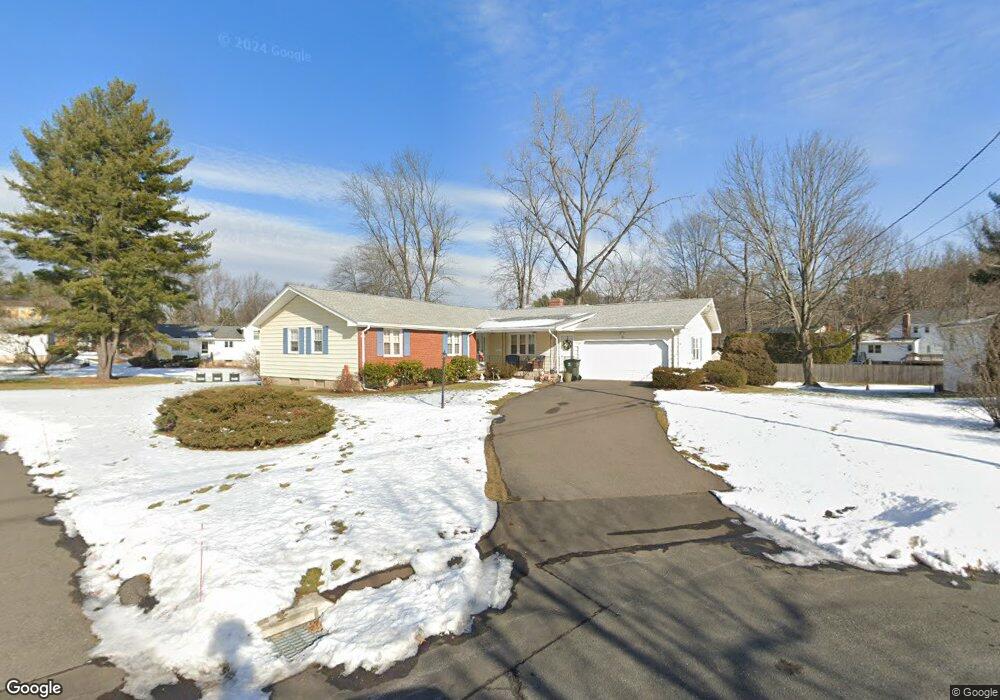
80 Vardon Rd West Hartford, CT 06117
Estimated Value: $560,302 - $628,000
3
Beds
3
Baths
1,880
Sq Ft
$319/Sq Ft
Est. Value
About This Home
This home is located at 80 Vardon Rd, West Hartford, CT 06117 and is currently estimated at $599,326, approximately $318 per square foot. 80 Vardon Rd is a home located in Hartford County with nearby schools including Aiken School, King Philip Middle School, and Delta High School.
Ownership History
Date
Name
Owned For
Owner Type
Purchase Details
Closed on
Jun 23, 2011
Sold by
Semenyaka Igor
Bought by
Semenyaka Elena
Current Estimated Value
Purchase Details
Closed on
Apr 2, 2007
Sold by
Hemphill Robert B and Hemphill Sheryl B
Bought by
Semenyaka Igor and Semenyaka Elena
Home Financials for this Owner
Home Financials are based on the most recent Mortgage that was taken out on this home.
Original Mortgage
$333,756
Interest Rate
6.33%
Purchase Details
Closed on
Feb 24, 2006
Sold by
Flint Jason
Bought by
Hemphill Robert B and Hemphill Sheryl B
Home Financials for this Owner
Home Financials are based on the most recent Mortgage that was taken out on this home.
Original Mortgage
$150,000
Interest Rate
6.17%
Purchase Details
Closed on
Oct 25, 2005
Sold by
Hershfeld Bettye T
Bought by
Flint Jason
Home Financials for this Owner
Home Financials are based on the most recent Mortgage that was taken out on this home.
Original Mortgage
$256,500
Interest Rate
5.72%
Create a Home Valuation Report for This Property
The Home Valuation Report is an in-depth analysis detailing your home's value as well as a comparison with similar homes in the area
Home Values in the Area
Average Home Value in this Area
Purchase History
| Date | Buyer | Sale Price | Title Company |
|---|---|---|---|
| Semenyaka Elena | -- | -- | |
| Semenyaka Igor | $365,000 | -- | |
| Hemphill Robert B | $353,000 | -- | |
| Flint Jason | $285,000 | -- |
Source: Public Records
Mortgage History
| Date | Status | Borrower | Loan Amount |
|---|---|---|---|
| Previous Owner | Flint Jason | $333,756 | |
| Previous Owner | Flint Jason | $150,000 | |
| Previous Owner | Flint Jason | $256,500 |
Source: Public Records
Tax History Compared to Growth
Tax History
| Year | Tax Paid | Tax Assessment Tax Assessment Total Assessment is a certain percentage of the fair market value that is determined by local assessors to be the total taxable value of land and additions on the property. | Land | Improvement |
|---|---|---|---|---|
| 2025 | $10,702 | $238,980 | $90,510 | $148,470 |
| 2024 | $10,121 | $238,980 | $90,510 | $148,470 |
| 2023 | $9,779 | $238,980 | $90,510 | $148,470 |
| 2022 | $9,722 | $238,980 | $90,510 | $148,470 |
| 2021 | $8,953 | $211,050 | $79,240 | $131,810 |
| 2020 | $8,872 | $212,240 | $79,100 | $133,140 |
| 2019 | $8,798 | $210,490 | $79,100 | $131,390 |
| 2018 | $8,630 | $210,490 | $79,100 | $131,390 |
| 2017 | $8,639 | $210,490 | $79,100 | $131,390 |
| 2016 | $8,369 | $211,820 | $67,410 | $144,410 |
| 2015 | $8,115 | $211,820 | $67,410 | $144,410 |
| 2014 | $7,916 | $211,820 | $67,410 | $144,410 |
Source: Public Records
Map
Nearby Homes
- 5 Adams Ln
- 1993 Albany Ave
- 5 Northmoor Rd
- 320 N Steele Rd
- 175 Scarborough St
- 111 Bloomfield Ave
- 3 Pilgrim Rd
- 165 Bloomfield Ave
- 275 Kenyon St
- 11 Lawler Rd
- 276 Oxford St Unit 278
- 260 Oxford St Unit 262
- 25 Cornwall St
- 103 Baltimore St
- 111 Westbourne Pkwy Unit 113
- 120 Whitney St
- 237 Fern St Unit 314
- 1272 Trout Brook Dr
- 109 Blue Hills Ave
- 62 Whitney St