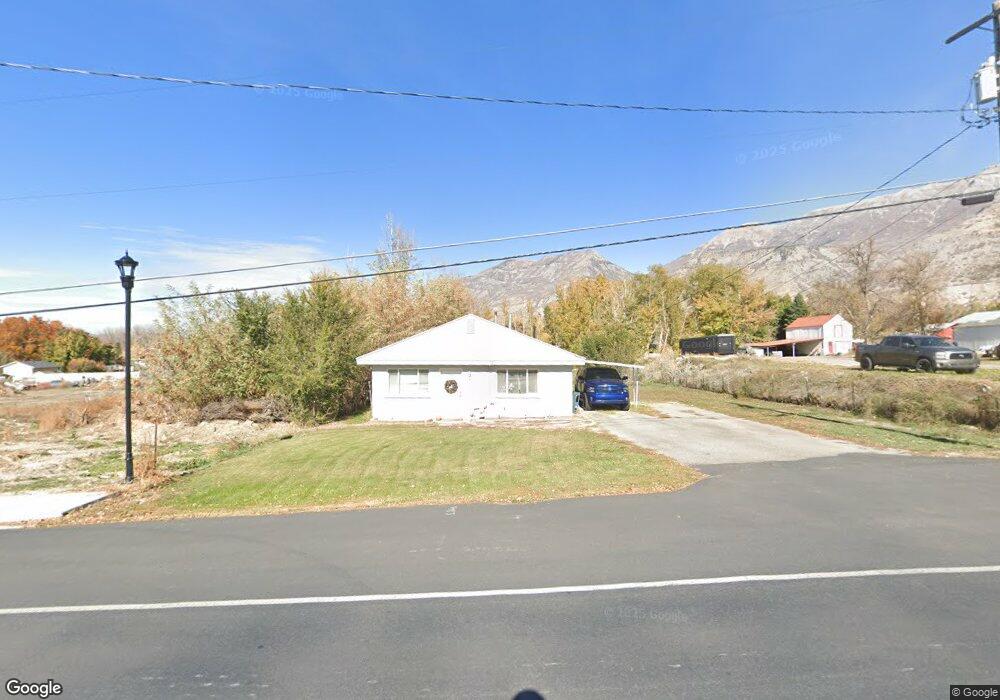
80 W 400 N Lindon, UT 84042
Estimated Value: $459,000 - $585,000
3
Beds
1
Bath
1,064
Sq Ft
$492/Sq Ft
Est. Value
About This Home
This home is located at 80 W 400 N, Lindon, UT 84042 and is currently estimated at $523,947, approximately $492 per square foot. 80 W 400 N is a home located in Utah County with nearby schools including Lindon Elementary School, Oak Canyon Junior High School, and Pleasant Grove High School.
Ownership History
Date
Name
Owned For
Owner Type
Purchase Details
Closed on
Nov 18, 2025
Sold by
Baxter Danny L
Bought by
Baxter Danny L and Wallis Melinda
Current Estimated Value
Purchase Details
Closed on
Sep 26, 1997
Sold by
Larson Marilyn B and Baxter Danny L
Bought by
Baxter Danny L
Home Financials for this Owner
Home Financials are based on the most recent Mortgage that was taken out on this home.
Original Mortgage
$61,000
Interest Rate
7.44%
Create a Home Valuation Report for This Property
The Home Valuation Report is an in-depth analysis detailing your home's value as well as a comparison with similar homes in the area
Home Values in the Area
Average Home Value in this Area
Purchase History
| Date | Buyer | Sale Price | Title Company |
|---|---|---|---|
| Baxter Danny L | -- | Gt Title Services | |
| Baxter Danny L | -- | Provo Land Title |
Source: Public Records
Mortgage History
| Date | Status | Borrower | Loan Amount |
|---|---|---|---|
| Previous Owner | Baxter Danny L | $61,000 |
Source: Public Records
Tax History
| Year | Tax Paid | Tax Assessment Tax Assessment Total Assessment is a certain percentage of the fair market value that is determined by local assessors to be the total taxable value of land and additions on the property. | Land | Improvement |
|---|---|---|---|---|
| 2025 | $1,848 | $249,810 | -- | -- |
| 2024 | $1,848 | $227,810 | $0 | $0 |
| 2023 | $1,728 | $228,855 | $0 | $0 |
| 2022 | $1,796 | $229,735 | $0 | $0 |
| 2021 | $1,445 | $278,700 | $195,900 | $82,800 |
| 2020 | $1,333 | $253,000 | $174,900 | $78,100 |
| 2019 | $1,151 | $228,000 | $149,900 | $78,100 |
| 2018 | $1,077 | $201,100 | $133,200 | $67,900 |
| 2017 | $990 | $99,165 | $0 | $0 |
| 2016 | $944 | $87,395 | $0 | $0 |
| 2015 | -- | $83,160 | $0 | $0 |
| 2014 | $811 | $70,345 | $0 | $0 |
Source: Public Records
Map
Nearby Homes
Your Personal Tour Guide
Ask me questions while you tour the home.