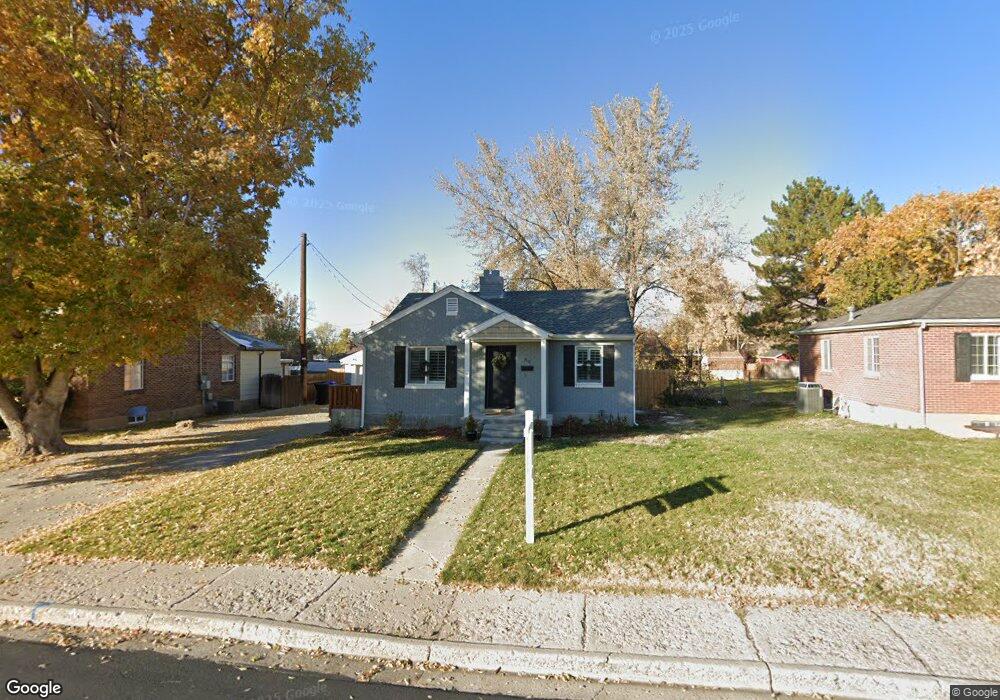
80 W 700 N Bountiful, UT 84010
Estimated Value: $459,000 - $513,000
4
Beds
2
Baths
1,632
Sq Ft
$301/Sq Ft
Est. Value
About This Home
This home is located at 80 W 700 N, Bountiful, UT 84010 and is currently estimated at $490,932, approximately $300 per square foot. 80 W 700 N is a home located in Davis County with nearby schools including Meadowbrook Elementary School, Bountiful Junior High School, and Viewmont High School.
Ownership History
Date
Name
Owned For
Owner Type
Purchase Details
Closed on
Mar 7, 2023
Sold by
Vantussenbrook Colten and Vantussenbrook Sidney
Bought by
West Michelle
Current Estimated Value
Home Financials for this Owner
Home Financials are based on the most recent Mortgage that was taken out on this home.
Original Mortgage
$452,000
Outstanding Balance
$437,298
Interest Rate
6.13%
Mortgage Type
VA
Estimated Equity
$53,634
Purchase Details
Closed on
Jun 10, 2019
Sold by
Jones Cassie Wilma
Bought by
Yan Tussenbrook Colten Van and Yan Tussenbrook Sindey
Home Financials for this Owner
Home Financials are based on the most recent Mortgage that was taken out on this home.
Original Mortgage
$320,100
Interest Rate
4.2%
Mortgage Type
New Conventional
Purchase Details
Closed on
May 19, 2006
Sold by
Term Investments Llc
Bought by
Weeks E Nordell
Create a Home Valuation Report for This Property
The Home Valuation Report is an in-depth analysis detailing your home's value as well as a comparison with similar homes in the area
Purchase History
| Date | Buyer | Sale Price | Title Company |
|---|---|---|---|
| West Michelle | -- | First American Title | |
| Yan Tussenbrook Colten Van | -- | Novation Title Ins Ag | |
| Weeks E Nordell | -- | None Available |
Source: Public Records
Mortgage History
| Date | Status | Borrower | Loan Amount |
|---|---|---|---|
| Open | West Michelle | $452,000 | |
| Previous Owner | Yan Tussenbrook Colten Van | $320,100 |
Source: Public Records
Tax History
| Year | Tax Paid | Tax Assessment Tax Assessment Total Assessment is a certain percentage of the fair market value that is determined by local assessors to be the total taxable value of land and additions on the property. | Land | Improvement |
|---|---|---|---|---|
| 2025 | $2,773 | $249,150 | $133,804 | $115,346 |
| 2024 | $2,602 | $243,100 | $120,006 | $123,094 |
| 2023 | $2,545 | $432,000 | $220,402 | $211,598 |
| 2022 | $2,675 | $249,700 | $120,249 | $129,451 |
| 2021 | $2,371 | $338,000 | $157,390 | $180,610 |
| 2020 | $2,088 | $298,000 | $134,191 | $163,809 |
| 2019 | $1,810 | $249,000 | $139,998 | $109,002 |
| 2018 | $1,661 | $224,000 | $137,192 | $86,808 |
| 2016 | $1,455 | $106,370 | $57,424 | $48,946 |
| 2015 | $1,315 | $89,925 | $57,424 | $32,501 |
| 2014 | $1,304 | $92,028 | $57,424 | $34,604 |
| 2013 | -- | $92,177 | $36,190 | $55,987 |
Source: Public Records
Map
Nearby Homes
- 106 W 700 N
- 184 Park Shadows Cir
- 563 N 200 W
- 499 N 200 W Unit 30
- 1130 N 200 W
- 320 N 200 W Unit 4
- 252 N Main St
- 256 N Main St
- 254 N Main St
- 332 N 300 W
- 1260 N 200 W
- 41 E 200 N Unit 6
- 49 E 200 N Unit 4
- 51 E 200 N Unit 3
- 55 E 200 N Unit 2
- 453 N 400 E Unit 7-D
- 366 W 1000 N
- 1420 N Main St
- 235 W 1400 N
- 401 W 400 N Unit 49
Your Personal Tour Guide
Ask me questions while you tour the home.