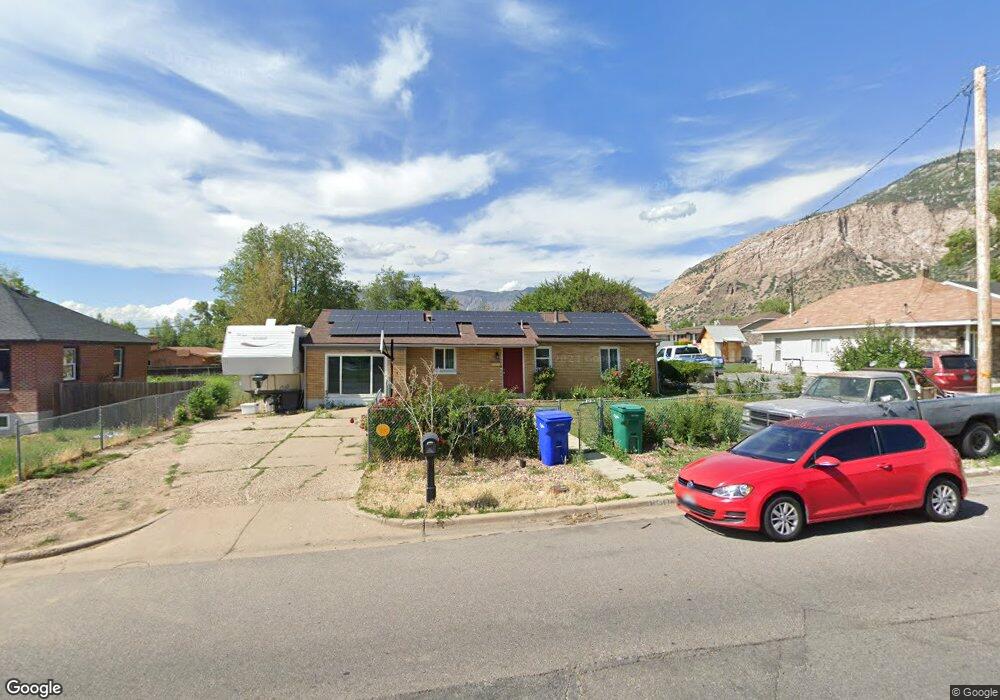
800 2nd St Ogden, UT 84404
Hillcrest-Bonneville NeighborhoodEstimated Value: $330,000 - $360,000
3
Beds
2
Baths
1,120
Sq Ft
$304/Sq Ft
Est. Value
About This Home
This home is located at 800 2nd St, Ogden, UT 84404 and is currently estimated at $340,608, approximately $304 per square foot. 800 2nd St is a home located in Weber County with nearby schools including Bonneville School, Highland Junior High School, and Ben Lomond High School.
Ownership History
Date
Name
Owned For
Owner Type
Purchase Details
Closed on
Jul 1, 2008
Sold by
Lasalle Bank Na
Bought by
Grondahl Eric and Grondahl Camilla
Current Estimated Value
Home Financials for this Owner
Home Financials are based on the most recent Mortgage that was taken out on this home.
Original Mortgage
$96,019
Outstanding Balance
$63,004
Interest Rate
6.41%
Mortgage Type
FHA
Estimated Equity
$277,604
Purchase Details
Closed on
Apr 18, 2008
Sold by
Brennan Joshua and Brennan Crystal
Bought by
Lasalle Bank Na and First Franklin Mortgage Loan Trust 2006-
Create a Home Valuation Report for This Property
The Home Valuation Report is an in-depth analysis detailing your home's value as well as a comparison with similar homes in the area
Home Values in the Area
Average Home Value in this Area
Purchase History
| Date | Buyer | Sale Price | Title Company |
|---|---|---|---|
| Grondahl Eric | -- | First American Union Heights | |
| Lasalle Bank Na | $92,842 | None Available |
Source: Public Records
Mortgage History
| Date | Status | Borrower | Loan Amount |
|---|---|---|---|
| Open | Grondahl Eric | $96,019 |
Source: Public Records
Tax History
| Year | Tax Paid | Tax Assessment Tax Assessment Total Assessment is a certain percentage of the fair market value that is determined by local assessors to be the total taxable value of land and additions on the property. | Land | Improvement |
|---|---|---|---|---|
| 2025 | $2,150 | $315,130 | $133,833 | $181,297 |
| 2024 | $2,146 | $169,948 | $73,608 | $96,340 |
| 2023 | $1,960 | $156,201 | $97,705 | $58,496 |
| 2022 | $2,148 | $171,600 | $50,845 | $120,755 |
| 2021 | $1,659 | $220,000 | $57,103 | $162,897 |
| 2020 | $1,518 | $185,999 | $46,727 | $139,272 |
| 2019 | $1,435 | $165,000 | $36,602 | $128,398 |
| 2018 | $1,243 | $142,000 | $31,605 | $110,395 |
| 2017 | $1,180 | $126,000 | $31,605 | $94,395 |
| 2016 | $996 | $57,451 | $17,096 | $40,355 |
| 2015 | $891 | $50,164 | $17,109 | $33,055 |
| 2014 | $846 | $46,753 | $17,109 | $29,644 |
Source: Public Records
Map
Nearby Homes
- 756 3rd St
- 758 3rd St
- 357 Monroe Blvd Unit 5
- 1010 1st St
- 570 2nd St
- 142 S Eccles Ave
- 537 Cook St
- 525 3rd St
- 1090 Harrop St
- 630 S Plum Creek Ln E
- 206 N Eccles Ave
- 580 Marco Ln
- 1062 Hudson St
- 584 Eccles Ave
- 352 N Liberty Ave
- 370 N Liberty Cove Dr Unit 5
- 322 Harrison Blvd
- 1149 Dan St
- 1636 Washington Blvd
- 621 7th St
Your Personal Tour Guide
Ask me questions while you tour the home.