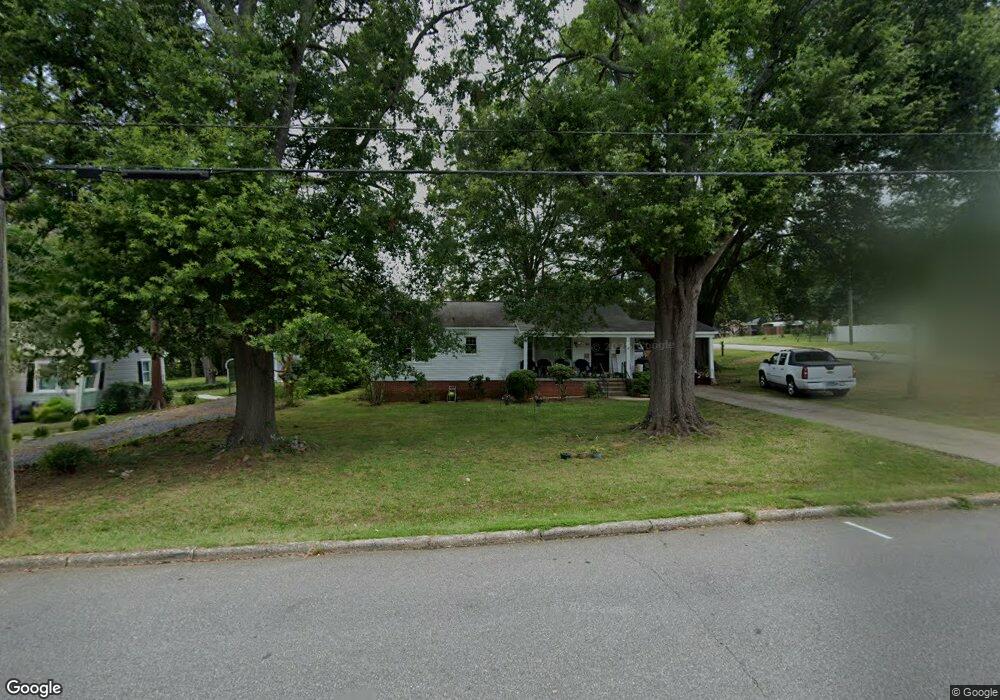
800 Broad St Shelby, NC 28152
Estimated Value: $178,836 - $231,000
3
Beds
2
Baths
1,293
Sq Ft
$156/Sq Ft
Est. Value
About This Home
This home is located at 800 Broad St, Shelby, NC 28152 and is currently estimated at $201,209, approximately $155 per square foot. 800 Broad St is a home located in Cleveland County with nearby schools including Graham Elementary School, James Love Elementary School, and Shelby Middle School.
Ownership History
Date
Name
Owned For
Owner Type
Purchase Details
Closed on
May 15, 2020
Sold by
Keeter Thomas Christopher and Keeter Donna
Bought by
Johnson & Johnson Investments Llc
Current Estimated Value
Home Financials for this Owner
Home Financials are based on the most recent Mortgage that was taken out on this home.
Original Mortgage
$145,000
Outstanding Balance
$128,490
Interest Rate
3.3%
Mortgage Type
Seller Take Back
Estimated Equity
$72,719
Purchase Details
Closed on
Dec 21, 2015
Sold by
Lynn William A and Lynn Mary G
Bought by
Keeter Thomas C
Create a Home Valuation Report for This Property
The Home Valuation Report is an in-depth analysis detailing your home's value as well as a comparison with similar homes in the area
Home Values in the Area
Average Home Value in this Area
Purchase History
| Date | Buyer | Sale Price | Title Company |
|---|---|---|---|
| Johnson & Johnson Investments Llc | $150,000 | None Available | |
| Keeter Thomas C | $15,850 | None Available |
Source: Public Records
Mortgage History
| Date | Status | Borrower | Loan Amount |
|---|---|---|---|
| Open | Johnson & Johnson Investments Llc | $145,000 |
Source: Public Records
Tax History Compared to Growth
Tax History
| Year | Tax Paid | Tax Assessment Tax Assessment Total Assessment is a certain percentage of the fair market value that is determined by local assessors to be the total taxable value of land and additions on the property. | Land | Improvement |
|---|---|---|---|---|
| 2025 | $1,084 | $108,947 | $16,588 | $92,359 |
| 2024 | $796 | $63,973 | $12,441 | $51,532 |
| 2023 | $796 | $63,973 | $12,441 | $51,532 |
| 2022 | $792 | $63,973 | $12,441 | $51,532 |
| 2021 | $796 | $63,973 | $12,441 | $51,532 |
| 2020 | $594 | $46,056 | $10,368 | $35,688 |
| 2019 | $594 | $46,056 | $10,368 | $35,688 |
| 2018 | $593 | $46,056 | $10,368 | $35,688 |
| 2017 | $579 | $46,056 | $10,368 | $35,688 |
| 2016 | $579 | $46,056 | $10,368 | $35,688 |
| 2015 | $806 | $68,135 | $11,404 | $56,731 |
| 2014 | $806 | $68,135 | $11,404 | $56,731 |
Source: Public Records
Map
Nearby Homes