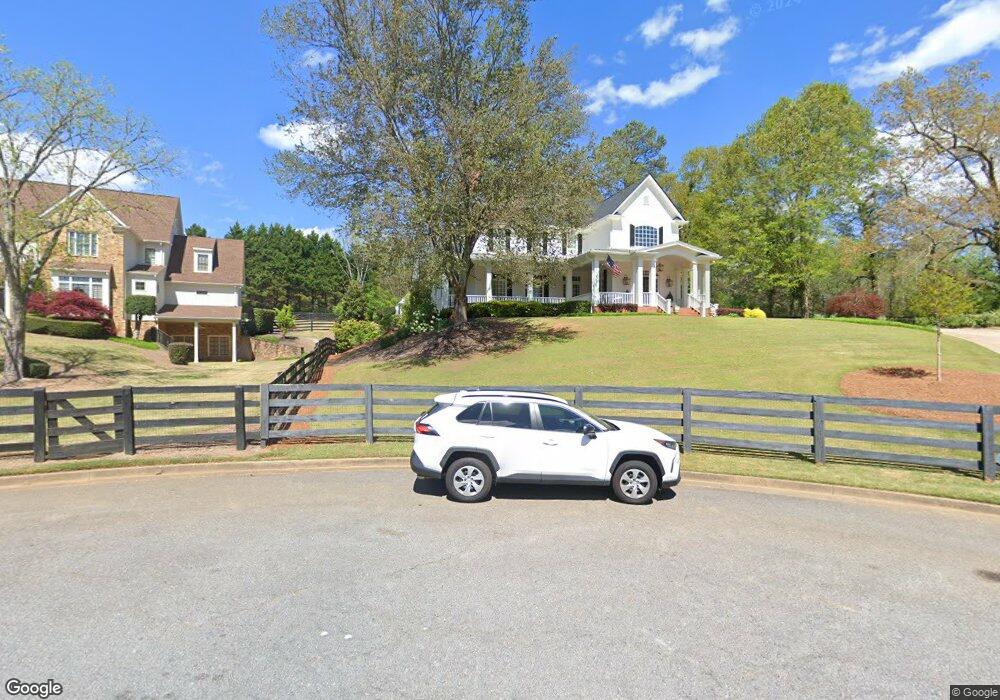
800 Cooper Sandy Cove Alpharetta, GA 30004
Estimated Value: $1,415,467 - $1,768,000
7
Beds
7
Baths
5,469
Sq Ft
$296/Sq Ft
Est. Value
About This Home
This home is located at 800 Cooper Sandy Cove, Alpharetta, GA 30004 and is currently estimated at $1,619,867, approximately $296 per square foot. 800 Cooper Sandy Cove is a home located in Fulton County with nearby schools including Summit Hill Elementary School, Hopewell Middle School, and Cambridge High School.
Ownership History
Date
Name
Owned For
Owner Type
Purchase Details
Closed on
Oct 26, 2017
Sold by
Canouse Joseph C
Bought by
Canouse Joseph C and Canouse Aron
Current Estimated Value
Purchase Details
Closed on
Jun 6, 2017
Sold by
Jones Gregory
Bought by
Heritage Select Llc
Purchase Details
Closed on
Oct 23, 2008
Sold by
Jones Gregory
Bought by
Jones Karolyn C D
Purchase Details
Closed on
Sep 29, 2006
Sold by
Cegala Joseph J
Bought by
Jones Gregory
Home Financials for this Owner
Home Financials are based on the most recent Mortgage that was taken out on this home.
Original Mortgage
$400,000
Interest Rate
6.38%
Mortgage Type
New Conventional
Purchase Details
Closed on
Nov 6, 1997
Sold by
Chatham Homes Inc
Bought by
Koepsell Jeffrey D and Koepsell Linda
Create a Home Valuation Report for This Property
The Home Valuation Report is an in-depth analysis detailing your home's value as well as a comparison with similar homes in the area
Home Values in the Area
Average Home Value in this Area
Purchase History
| Date | Buyer | Sale Price | Title Company |
|---|---|---|---|
| Canouse Joseph C | -- | -- | |
| Canouse Joseph C | $940,000 | -- | |
| Heritage Select Llc | $705,100 | -- | |
| Jones Karolyn C D | -- | -- | |
| Jones Gregory | $1,040,000 | -- | |
| Koepsell Jeffrey D | $737,900 | -- |
Source: Public Records
Mortgage History
| Date | Status | Borrower | Loan Amount |
|---|---|---|---|
| Previous Owner | Jones Gregory | $400,000 | |
| Closed | Koepsell Jeffrey D | -- |
Source: Public Records
Tax History Compared to Growth
Tax History
| Year | Tax Paid | Tax Assessment Tax Assessment Total Assessment is a certain percentage of the fair market value that is determined by local assessors to be the total taxable value of land and additions on the property. | Land | Improvement |
|---|---|---|---|---|
| 2025 | $1,776 | $648,920 | $122,360 | $526,560 |
| 2023 | $10,955 | $388,120 | $104,800 | $283,320 |
| 2022 | $9,537 | $388,120 | $104,800 | $283,320 |
| 2021 | $9,532 | $376,840 | $101,760 | $275,080 |
| 2020 | $9,638 | $372,360 | $100,560 | $271,800 |
| 2019 | $1,821 | $365,760 | $98,760 | $267,000 |
| 2018 | $9,565 | $357,200 | $96,440 | $260,760 |
| 2017 | $10,063 | $344,920 | $69,920 | $275,000 |
| 2016 | $10,066 | $344,920 | $69,920 | $275,000 |
| 2015 | $11,739 | $344,920 | $69,920 | $275,000 |
| 2014 | $10,573 | $344,920 | $69,920 | $275,000 |
Source: Public Records
Map
Nearby Homes
- 13365 Hopewell Rd
- 735 Hammock Ln
- 2355 Hopewell Plantation Dr Unit 1
- 14050 Providence Rd
- 2470 Hopewell Plantation Dr
- 13825 Cowart Rd
- 165 Oakhurst Leaf Dr Unit 4
- 305 Rhodes Chase Ct
- 14200 Hopewell Rd
- Lot 2 Cowart Rd
- LOT 2 13920 Cowart Rd
- 13890 Cowart Rd
- 705 Nettlebrook Ln
- 2215 Traywick Chase
- 139200 Cowart Rd
- 4110 Providence Square
- 4075 Haven Terrace
- 1895 Henley Way
- 14040 Providence Rd
- 4016 Dover Ave
- 790 Cooper Sandy Cove
- 845 Cooper Sandy Cove
- 835 Cooper Sandy Cove
- 780 Cooper Sandy Cove
- 825 Cooper Sandy Cove
- 770 Cooper Sandy Cove
- 2035 Bethany Way
- 13610 Hopewell Rd
- 760 Cooper Sandy Cove
- 810 Cooper Sandy Cove
- 2055 Bethany Way
- 2029 Bethany Way
- 740 Cooper Sandy Cove
- 750 Cooper Sandy Cove
- 100 Cooper Sandy Point
- 2025 Bethany Way
- 730 Cooper Sandy Cove
- 13450 Hopewell Rd
- 0 Cooper Sandy Cove Unit 3272826
- 0 Cooper Sandy Cove Unit 7373161