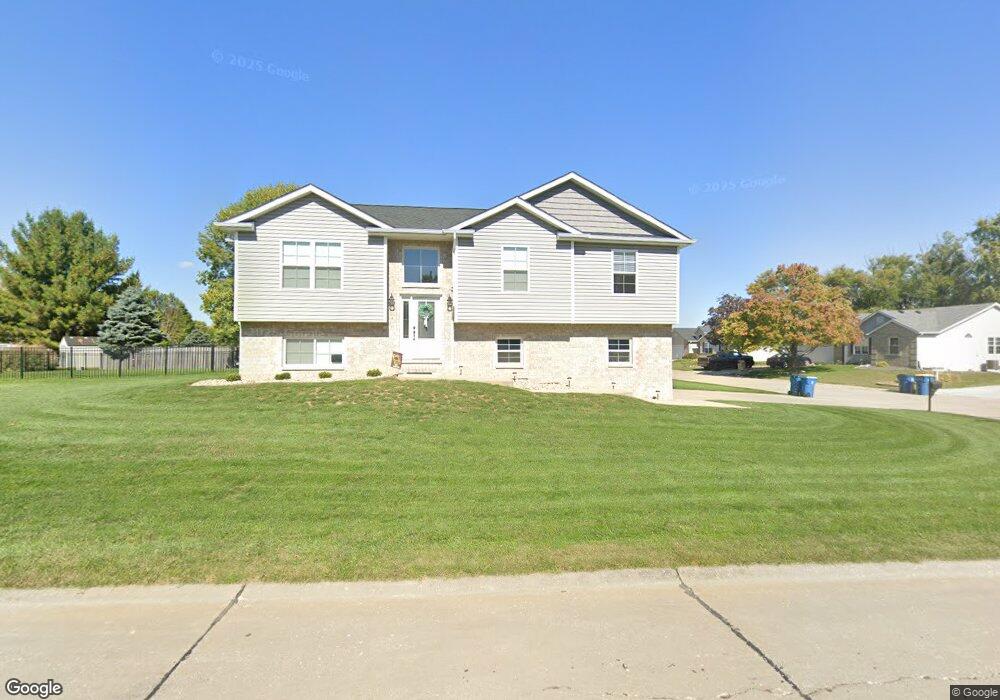
800 Copper Ridge Dr Maryville, IL 62062
Estimated Value: $301,000 - $346,000
3
Beds
2
Baths
1,380
Sq Ft
$232/Sq Ft
Est. Value
About This Home
This home is located at 800 Copper Ridge Dr, Maryville, IL 62062 and is currently estimated at $320,843, approximately $232 per square foot. 800 Copper Ridge Dr is a home located in Madison County with nearby schools including Maryville Elementary School, Dorris Intermediate School, and Collinsville Middle School.
Ownership History
Date
Name
Owned For
Owner Type
Purchase Details
Closed on
Dec 31, 2018
Sold by
Hunziker Properties Inc
Bought by
Burton Cole E and Cable Megan K
Current Estimated Value
Home Financials for this Owner
Home Financials are based on the most recent Mortgage that was taken out on this home.
Original Mortgage
$197,910
Outstanding Balance
$174,702
Interest Rate
4.8%
Mortgage Type
New Conventional
Estimated Equity
$146,141
Purchase Details
Closed on
Apr 25, 2017
Sold by
Sweeten Michael
Bought by
Hunziker Properties Inc
Purchase Details
Closed on
Mar 20, 2017
Sold by
Dentici Louis M and Dentici Margaret S
Bought by
Sweeten Michael
Purchase Details
Closed on
Jul 9, 2004
Sold by
Karvinen Tracy L and Polson Susan M
Bought by
Dentici Louis M and Dentici Margaret S
Create a Home Valuation Report for This Property
The Home Valuation Report is an in-depth analysis detailing your home's value as well as a comparison with similar homes in the area
Home Values in the Area
Average Home Value in this Area
Purchase History
| Date | Buyer | Sale Price | Title Company |
|---|---|---|---|
| Burton Cole E | $220,000 | Metro Title | |
| Hunziker Properties Inc | $23,000 | Metro Title | |
| Hunziker Properties Inc | -- | Metro Title & Escrow | |
| Sweeten Michael | $20,000 | Abstracts And Titles | |
| Dentici Louis M | $153,000 | Mti |
Source: Public Records
Mortgage History
| Date | Status | Borrower | Loan Amount |
|---|---|---|---|
| Open | Burton Cole E | $197,910 |
Source: Public Records
Tax History Compared to Growth
Tax History
| Year | Tax Paid | Tax Assessment Tax Assessment Total Assessment is a certain percentage of the fair market value that is determined by local assessors to be the total taxable value of land and additions on the property. | Land | Improvement |
|---|---|---|---|---|
| 2024 | $5,220 | $83,890 | $19,510 | $64,380 |
| 2023 | $5,220 | $77,650 | $18,060 | $59,590 |
| 2022 | $4,923 | $71,800 | $16,700 | $55,100 |
| 2021 | $4,225 | $64,680 | $14,950 | $49,730 |
| 2020 | $4,061 | $61,710 | $14,260 | $47,450 |
| 2019 | $3,938 | $59,600 | $13,770 | $45,830 |
| 2018 | $988 | $13,040 | $13,040 | $0 |
| 2017 | $986 | $12,780 | $12,780 | $0 |
| 2016 | $4,660 | $57,540 | $12,780 | $44,760 |
| 2015 | $4,347 | $56,050 | $12,450 | $43,600 |
| 2014 | $4,347 | $56,050 | $12,450 | $43,600 |
| 2013 | $4,347 | $56,050 | $12,450 | $43,600 |
Source: Public Records
Map
Nearby Homes
- 1 Heather Green
- 2009 Buttonwood Ct
- 1844 Crimson Oak Dr
- 1831 Crimson Oak Dr
- 1830 Robin Mills Ct
- 1819 Robin Mills Ct
- 1826 Robin Mills Ct
- 1815 Robins Mill Ct
- 2301 Preswyck Ct
- 963 Long Branch Rd
- 0 Homes of Liberty Place
- 6817 Bouse Rd
- 419 N Donk Ave
- 10 Dunbridge Ct
- 77 Kingsley Way
- 6 Grant Ct
- Winchester A Plan at Homes of Liberty Place
- Winchester B Plan at Homes of Liberty Place
- Herndon Plan at Homes of Liberty Place
- Hannah Plan at Homes of Liberty Place
- 800 Copper Ridge
- 804 Copper Ridge
- 2416 Copper Creek Rd
- 808 Copper Ridge
- 2412 Copper Creek Rd
- 801 Copper Ridge Dr
- 2421 Copper Creek Rd
- 2417 Copper Creek Rd
- 2429 Copper Creek Rd
- 2425 Copper Creek Rd
- 2413 Copper Creek Rd
- 2337 Westchester Dr
- 805 Copper Ridge
- 2049 Pinehurst Way
- 809 Copper Ridge
- 812 Copper Ridge
- 2408 Copper Creek Rd
- 2045 Pinehurst Way
- 2409 Copper Creek Rd
- 813 Copper Ridge