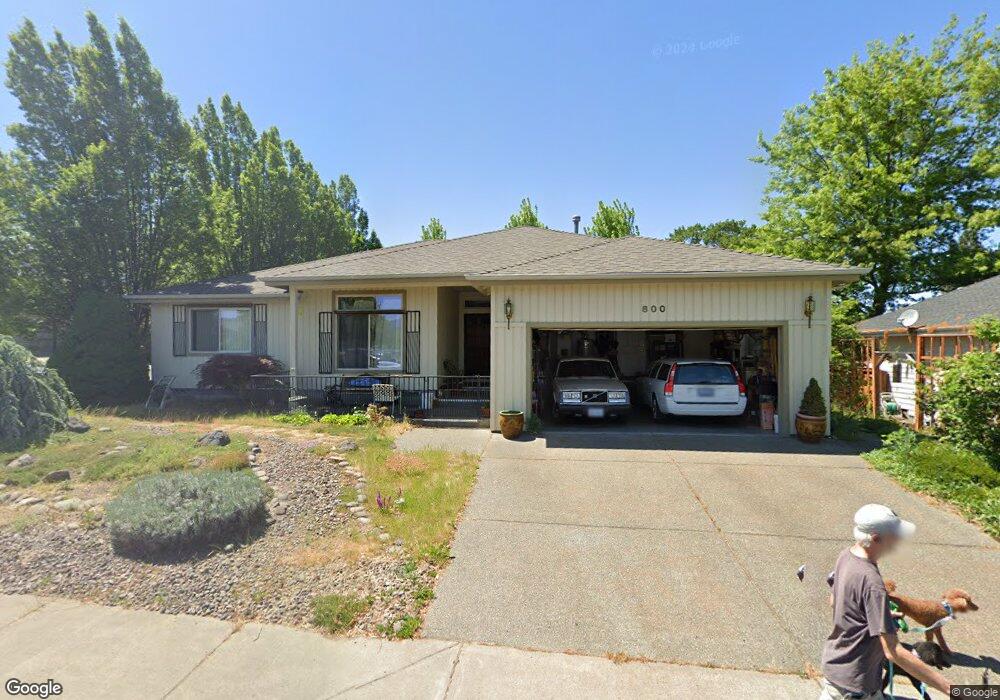
800 Cypress Point Loop Ashland, OR 97520
Oak Knoll NeighborhoodEstimated Value: $504,000 - $563,000
3
Beds
2
Baths
1,898
Sq Ft
$285/Sq Ft
Est. Value
About This Home
This home is located at 800 Cypress Point Loop, Ashland, OR 97520 and is currently estimated at $541,647, approximately $285 per square foot. 800 Cypress Point Loop is a home located in Jackson County with nearby schools including Bellview Elementary School, Ashland Middle School, and Ashland High School.
Ownership History
Date
Name
Owned For
Owner Type
Purchase Details
Closed on
Aug 3, 2004
Sold by
Bernds William P and Anderson Sheila C
Bought by
Zetterberg Adolf B and Zetterberg Carolyn E
Current Estimated Value
Purchase Details
Closed on
Apr 28, 2003
Sold by
Vittetoe Annerose F and Vittetoe Family Trust
Bought by
Bernds William P and Anderson Sheila C
Home Financials for this Owner
Home Financials are based on the most recent Mortgage that was taken out on this home.
Original Mortgage
$125,000
Interest Rate
5.72%
Purchase Details
Closed on
Apr 26, 2003
Sold by
Bernds William P and Anderson Sheila C
Bought by
Bernds William P and Anderson Sheila C
Home Financials for this Owner
Home Financials are based on the most recent Mortgage that was taken out on this home.
Original Mortgage
$125,000
Interest Rate
5.72%
Create a Home Valuation Report for This Property
The Home Valuation Report is an in-depth analysis detailing your home's value as well as a comparison with similar homes in the area
Home Values in the Area
Average Home Value in this Area
Purchase History
| Date | Buyer | Sale Price | Title Company |
|---|---|---|---|
| Zetterberg Adolf B | $339,000 | First American | |
| Bernds William P | $325,000 | Lawyers Title Insurance Corp | |
| Bernds William P | -- | -- |
Source: Public Records
Mortgage History
| Date | Status | Borrower | Loan Amount |
|---|---|---|---|
| Previous Owner | Bernds William P | $125,000 |
Source: Public Records
Tax History
| Year | Tax Paid | Tax Assessment Tax Assessment Total Assessment is a certain percentage of the fair market value that is determined by local assessors to be the total taxable value of land and additions on the property. | Land | Improvement |
|---|---|---|---|---|
| 2026 | $6,728 | $362,730 | $203,000 | $159,730 |
| 2025 | $6,601 | $434,140 | $236,100 | $198,040 |
| 2024 | $6,601 | $421,500 | $229,220 | $192,280 |
| 2023 | $6,386 | $409,230 | $222,550 | $186,680 |
| 2022 | $6,181 | $409,230 | $222,550 | $186,680 |
| 2021 | $5,970 | $397,320 | $216,080 | $181,240 |
| 2020 | $5,802 | $385,750 | $209,790 | $175,960 |
| 2019 | $5,712 | $363,620 | $197,770 | $165,850 |
| 2018 | $5,393 | $353,030 | $192,010 | $161,020 |
| 2017 | $5,313 | $353,030 | $192,010 | $161,020 |
| 2016 | $5,127 | $332,770 | $180,990 | $151,780 |
| 2015 | $4,896 | $332,770 | $180,990 | $151,780 |
| 2014 | $4,746 | $313,670 | $170,600 | $143,070 |
Source: Public Records
Map
Nearby Homes
- 1087 Oak Knoll Dr
- 938 Cypress Point Loop
- 376 Crowson Rd
- 488 Crowson Rd
- 854 Twin Pines Cir Unit 7
- 805 Oak Knoll Dr
- 2799 Siskiyou Blvd Unit 30
- 2799 Siskiyou Blvd Unit 7
- 2799 Siskiyou Blvd Unit 36
- 766 E Jefferson Ave
- 610 Sutton Place
- 601 Washington St
- 288 Maywood Way
- 551 Sutton Place
- 996 Spring Way
- 582 Washington St
- 30 Knoll Crest Dr
- 510 Washington St
- 0 Dead Indian Memorial Rd Unit 1400
- 2299 Siskiyou Blvd Unit 13
- 806 Cypress Point Loop
- 803 Cypress Point Loop
- 1084 Oak Knoll Dr
- 1093 Oak Knoll Dr
- 809 Cypress Point Loop
- 0 Cypress Point Loop
- 815 Cypress Point Loop
- 1105 Oak Knoll Dr
- 828 Cypress Point Loop
- 821 Cypress Point Loop
- 1072 Oak Knoll Dr
- 1111 Oak Knoll Dr
- 834 Cypress Point Loop
- 740 Salishan Ct
- 1114 Oak Knoll Dr
- 1075 Oak Knoll Dr
- 833 Cypress Point Loop
- 1060 Oak Knoll Dr
- 840 Cypress Point Loop
- 760 Salishan Ct
Your Personal Tour Guide
Ask me questions while you tour the home.