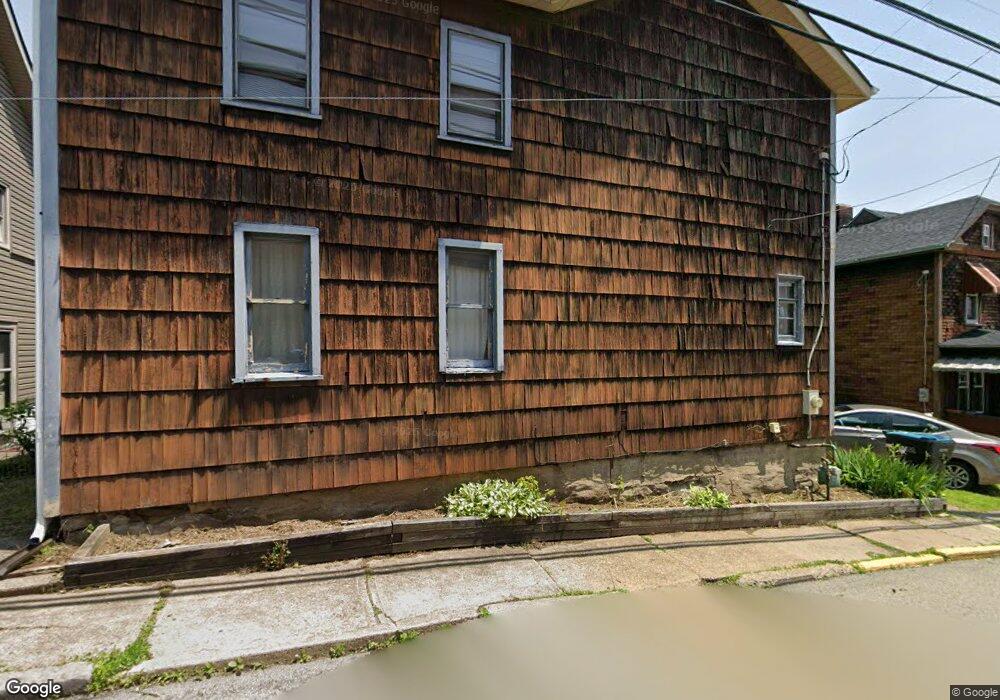
800 East St Tarentum, PA 15084
Estimated Value: $71,000 - $101,000
3
Beds
1
Bath
1,538
Sq Ft
$55/Sq Ft
Est. Value
About This Home
This home is located at 800 East St, Tarentum, PA 15084 and is currently estimated at $84,561, approximately $54 per square foot. 800 East St is a home located in Allegheny County with nearby schools including Highlands Senior High School and St. Joseph High School.
Ownership History
Date
Name
Owned For
Owner Type
Purchase Details
Closed on
Sep 11, 2008
Sold by
Doak Michael P
Bought by
Fisher Michelle M
Current Estimated Value
Home Financials for this Owner
Home Financials are based on the most recent Mortgage that was taken out on this home.
Original Mortgage
$45,000
Outstanding Balance
$29,960
Interest Rate
6.54%
Mortgage Type
New Conventional
Estimated Equity
$54,601
Purchase Details
Closed on
May 13, 1998
Sold by
Bajza Ann
Bought by
Cieslinski Kathleen M
Purchase Details
Closed on
Jun 24, 1997
Sold by
Cole Irma L
Bought by
Cieslinski Kathleen M
Create a Home Valuation Report for This Property
The Home Valuation Report is an in-depth analysis detailing your home's value as well as a comparison with similar homes in the area
Home Values in the Area
Average Home Value in this Area
Purchase History
| Date | Buyer | Sale Price | Title Company |
|---|---|---|---|
| Fisher Michelle M | $45,000 | -- | |
| Cieslinski Kathleen M | -- | -- | |
| Cieslinski Kathleen M | $42,000 | -- |
Source: Public Records
Mortgage History
| Date | Status | Borrower | Loan Amount |
|---|---|---|---|
| Open | Fisher Michelle M | $45,000 |
Source: Public Records
Tax History Compared to Growth
Tax History
| Year | Tax Paid | Tax Assessment Tax Assessment Total Assessment is a certain percentage of the fair market value that is determined by local assessors to be the total taxable value of land and additions on the property. | Land | Improvement |
|---|---|---|---|---|
| 2025 | $1,187 | $33,600 | $16,400 | $17,200 |
| 2024 | $1,187 | $33,600 | $16,400 | $17,200 |
| 2023 | $1,187 | $33,600 | $16,400 | $17,200 |
| 2022 | $1,179 | $33,600 | $16,400 | $17,200 |
| 2021 | $159 | $33,600 | $16,400 | $17,200 |
| 2020 | $1,179 | $33,600 | $16,400 | $17,200 |
| 2019 | $1,171 | $33,600 | $16,400 | $17,200 |
| 2018 | $159 | $33,600 | $16,400 | $17,200 |
| 2017 | $1,143 | $33,600 | $16,400 | $17,200 |
| 2016 | $159 | $33,600 | $16,400 | $17,200 |
| 2015 | $159 | $33,600 | $16,400 | $17,200 |
| 2014 | $1,143 | $33,600 | $16,400 | $17,200 |
Source: Public Records
Map
Nearby Homes