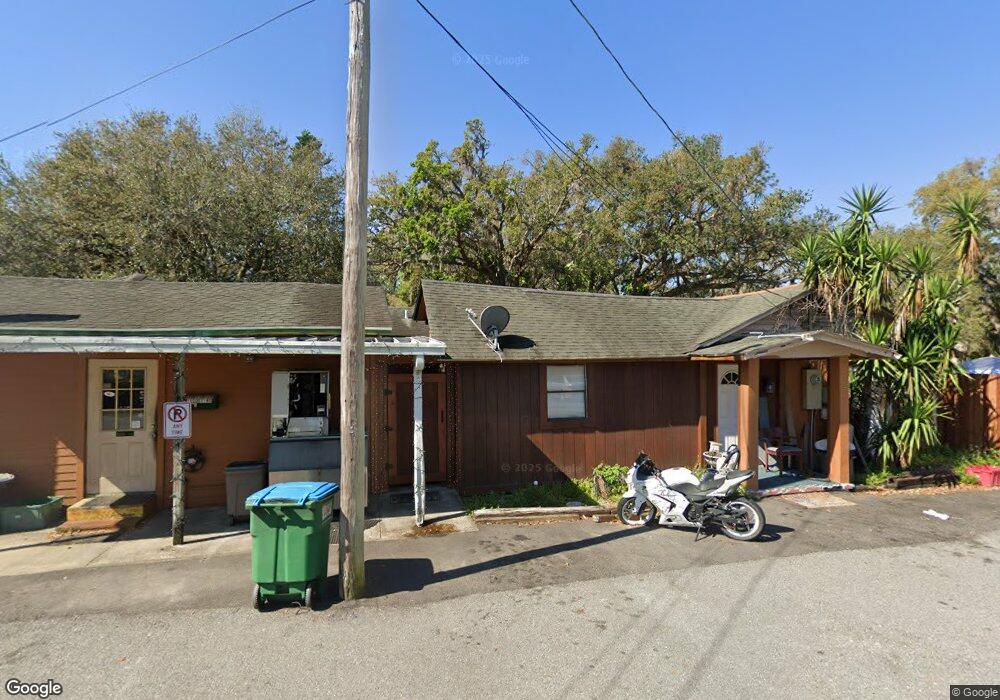
800 Flomich St Daytona Beach, FL 32117
Riviera NeighborhoodEstimated Value: $210,572 - $234,000
3
Beds
1
Bath
2,739
Sq Ft
$82/Sq Ft
Est. Value
About This Home
This home is located at 800 Flomich St, Daytona Beach, FL 32117 and is currently estimated at $224,524, approximately $81 per square foot. 800 Flomich St is a home located in Volusia County with nearby schools including Holly Hill School, Mainland High School, and Open Bible Christian Academy.
Ownership History
Date
Name
Owned For
Owner Type
Purchase Details
Closed on
Mar 1, 2007
Sold by
Goeke Robert L
Bought by
800 Flomich Llc
Current Estimated Value
Home Financials for this Owner
Home Financials are based on the most recent Mortgage that was taken out on this home.
Original Mortgage
$135,000
Interest Rate
10%
Mortgage Type
Commercial
Purchase Details
Closed on
Feb 9, 2006
Sold by
Goeke Robert
Bought by
Mcintyre James M
Purchase Details
Closed on
Jul 27, 2000
Sold by
Goeke Robert L and Silk Diane M
Bought by
Goeke Robert L
Purchase Details
Closed on
Feb 15, 1995
Sold by
Plants Dianne
Bought by
Goeke Robert and Silk Diane
Purchase Details
Closed on
Mar 15, 1992
Bought by
800 Flomich Llc
Purchase Details
Closed on
May 15, 1991
Bought by
800 Flomich Llc
Purchase Details
Closed on
Mar 15, 1987
Bought by
800 Flomich Llc
Create a Home Valuation Report for This Property
The Home Valuation Report is an in-depth analysis detailing your home's value as well as a comparison with similar homes in the area
Home Values in the Area
Average Home Value in this Area
Purchase History
| Date | Buyer | Sale Price | Title Company |
|---|---|---|---|
| 800 Flomich Llc | $150,000 | Fidelity Natl Title Ins Co | |
| Mcintyre James M | $1,000 | None Available | |
| Goeke Robert L | -- | -- | |
| Goeke Robert | $85,200 | -- | |
| 800 Flomich Llc | $65,000 | -- | |
| 800 Flomich Llc | $100 | -- | |
| 800 Flomich Llc | $125,000 | -- |
Source: Public Records
Mortgage History
| Date | Status | Borrower | Loan Amount |
|---|---|---|---|
| Closed | 800 Flomich Llc | $135,000 |
Source: Public Records
Tax History Compared to Growth
Tax History
| Year | Tax Paid | Tax Assessment Tax Assessment Total Assessment is a certain percentage of the fair market value that is determined by local assessors to be the total taxable value of land and additions on the property. | Land | Improvement |
|---|---|---|---|---|
| 2025 | $2,571 | $123,970 | $44,437 | $79,533 |
| 2024 | $2,571 | $126,473 | $44,437 | $82,036 |
| 2023 | $2,571 | $126,360 | $44,437 | $81,923 |
| 2022 | $2,521 | $119,867 | $44,437 | $75,430 |
| 2021 | $2,712 | $123,273 | $44,437 | $78,836 |
| 2020 | $2,768 | $128,495 | $48,141 | $80,354 |
| 2019 | $2,730 | $126,855 | $48,141 | $78,714 |
| 2018 | $2,781 | $125,803 | $48,141 | $77,662 |
| 2017 | $2,728 | $118,274 | $48,141 | $70,133 |
| 2016 | $2,743 | $115,221 | $0 | $0 |
| 2015 | $2,616 | $104,574 | $0 | $0 |
| 2014 | $2,463 | $98,323 | $0 | $0 |
Source: Public Records
Map
Nearby Homes
- 901 Kingsport Ct
- 919 Royal Oak Ct
- 1583 Montgomery Ave
- 1591 Revere Ln
- 1560 Hancock Ln
- 946 15th St Unit 201
- 946 15th St Unit 202
- 1544 Franklin Cir
- 555 Eagle Dr
- 548 Peacock Rd
- 1013 Alabama Ave
- 1518 Franklin Cir
- 1585 Tuscaloosa Ave
- 1615 Tuscaloosa Ave
- 1512 Heritage Ln
- 1504 Heritage Ln
- 1390 Powers Ave
- 1612 Primo Ct
- 1611 Spring Garden
- 1 Timber Trail
- 706 Flomich St
- 804 Flomich St
- 1596 Selma Ave
- 000 Flomich St
- 1617 Anniston Ave
- 1619 Anniston Ave
- 1603 Selma Ave
- 805 Flomich St
- 707 Flomich St
- 1594 Selma Ave
- 705 Flomich St
- 1607 Selma Ave
- 1623 Anniston Ave
- 1608 Selma Ave
- 807 Flomich St
- 703 Flomich St
- 1600 Montgomery Ave
- 1608 Montgomery Ave
- 1625 Anniston Ave
- 1592 Selma Ave