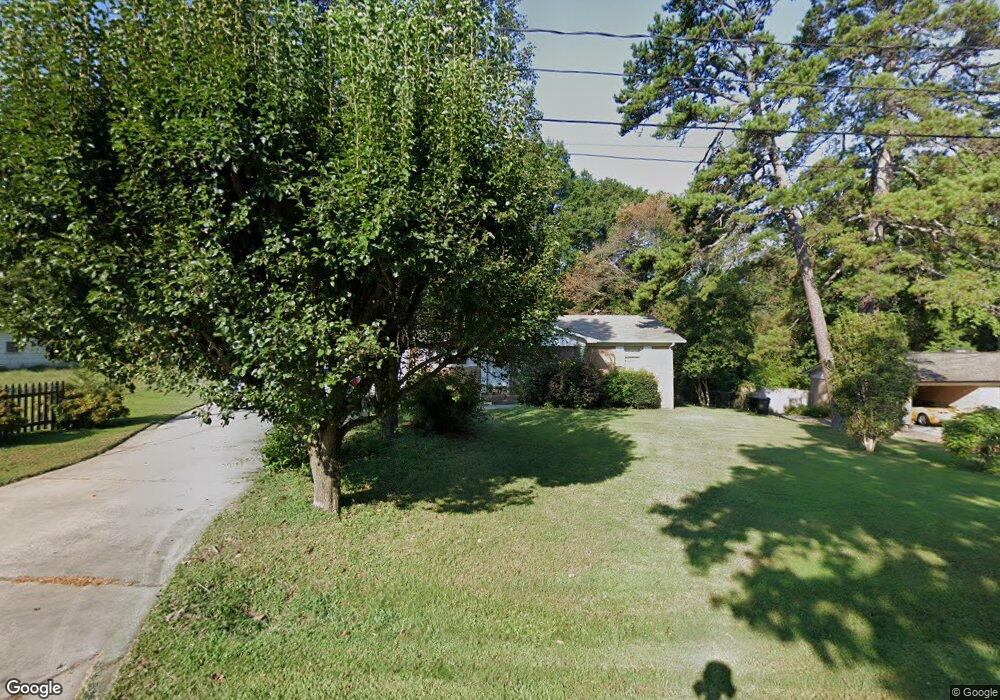
800 Gladden Place NW Concord, NC 28027
Estimated Value: $266,000 - $287,000
3
Beds
2
Baths
1,468
Sq Ft
$188/Sq Ft
Est. Value
About This Home
This home is located at 800 Gladden Place NW, Concord, NC 28027 and is currently estimated at $276,079, approximately $188 per square foot. 800 Gladden Place NW is a home located in Cabarrus County with nearby schools including Weddington Hills Elementary School, Harold E. Winkler Middle School, and Concord Academy.
Ownership History
Date
Name
Owned For
Owner Type
Purchase Details
Closed on
Aug 26, 2021
Sold by
Smith Richard W and Smith Jean H
Bought by
Corriher Katerina Mason
Current Estimated Value
Purchase Details
Closed on
Sep 20, 2005
Sold by
Stahr Shirley Gail and Stahr Alan
Bought by
Smith Richard W and Smith Jean H
Home Financials for this Owner
Home Financials are based on the most recent Mortgage that was taken out on this home.
Original Mortgage
$11,900
Outstanding Balance
$9,064
Interest Rate
5.86%
Mortgage Type
Credit Line Revolving
Estimated Equity
$267,015
Purchase Details
Closed on
Jul 30, 2004
Sold by
Hulslander Ruth L
Bought by
Stahr Shirley Gail and Wendlandt Carol Ann
Purchase Details
Closed on
Nov 25, 1998
Sold by
Kennedy Robert S and Kennedy Andrea L
Bought by
Hulslander Ruth L
Purchase Details
Closed on
Oct 1, 1993
Create a Home Valuation Report for This Property
The Home Valuation Report is an in-depth analysis detailing your home's value as well as a comparison with similar homes in the area
Home Values in the Area
Average Home Value in this Area
Purchase History
| Date | Buyer | Sale Price | Title Company |
|---|---|---|---|
| Corriher Katerina Mason | -- | None Available | |
| Smith Richard W | $111,000 | Multiple | |
| Stahr Shirley Gail | -- | -- | |
| Hulslander Ruth L | $90,000 | -- | |
| -- | $45,000 | -- |
Source: Public Records
Mortgage History
| Date | Status | Borrower | Loan Amount |
|---|---|---|---|
| Open | Smith Richard W | $11,900 | |
| Open | Smith Richard W | $89,559 |
Source: Public Records
Tax History Compared to Growth
Tax History
| Year | Tax Paid | Tax Assessment Tax Assessment Total Assessment is a certain percentage of the fair market value that is determined by local assessors to be the total taxable value of land and additions on the property. | Land | Improvement |
|---|---|---|---|---|
| 2025 | $2,267 | $227,590 | $65,000 | $162,590 |
| 2024 | $2,267 | $227,590 | $65,000 | $162,590 |
| 2023 | $1,630 | $133,620 | $38,000 | $95,620 |
| 2022 | $1,595 | $130,740 | $38,000 | $92,740 |
| 2021 | $1,595 | $130,740 | $38,000 | $92,740 |
| 2020 | $1,595 | $130,740 | $38,000 | $92,740 |
| 2019 | $1,254 | $102,750 | $30,000 | $72,750 |
| 2018 | $1,233 | $102,750 | $30,000 | $72,750 |
| 2017 | $1,212 | $102,750 | $30,000 | $72,750 |
| 2016 | $719 | $100,860 | $32,000 | $68,860 |
| 2015 | -- | $100,860 | $32,000 | $68,860 |
| 2014 | -- | $100,860 | $32,000 | $68,860 |
Source: Public Records
Map
Nearby Homes
- 699 Kitfox Dr NW
- 2628 Clipper Ct NW
- Roxbury Plan at Cannon Run
- 2161 Barnhardt Ave NW
- 2676 Poplar Cove Dr NW
- 757 Kitfox NW
- 765 Lock Haven Dr NW
- 759 Lock Haven Dr NW
- 763 Lock Haven Dr NW
- 755 Kitfox NW
- 761 Lock Haven Dr NW
- 759 Kitfox NW
- 754 Kitfox NW
- 758 Kitfox NW
- 752 Kitfox NW
- 749 Lock Haven Dr NW
- 747 Lock Haven Dr NW
- 751 Lock Haven Dr NW
- 745 Lock Haven Dr NW
- Manchester Plan at Piper Landing - Smart Series Townhomes
- 762 Gladden Place NW
- 2318 Helen Dr NW
- 2300 Helen Dr NW
- 2324 Helen Dr NW
- 2344 Helen Dr NW
- 801 Gladden Place NW
- 2298 Helen Dr NW
- 750 Gladden Place NW
- 763 Gladden Place NW
- 2354 Holly Hills Ct NW
- 2284 Helen Dr NW
- 751 Gladden Place NW
- 2229 Helen Dr NW
- 2350 Helen Dr NW
- 2315 Helen Dr NW
- 2360 Holly Hills Ct NW
- 2272 Helen Dr NW
- 2325 Helen Dr NW
- 835 Gladden Place NW
- 2283 Helen Dr NW