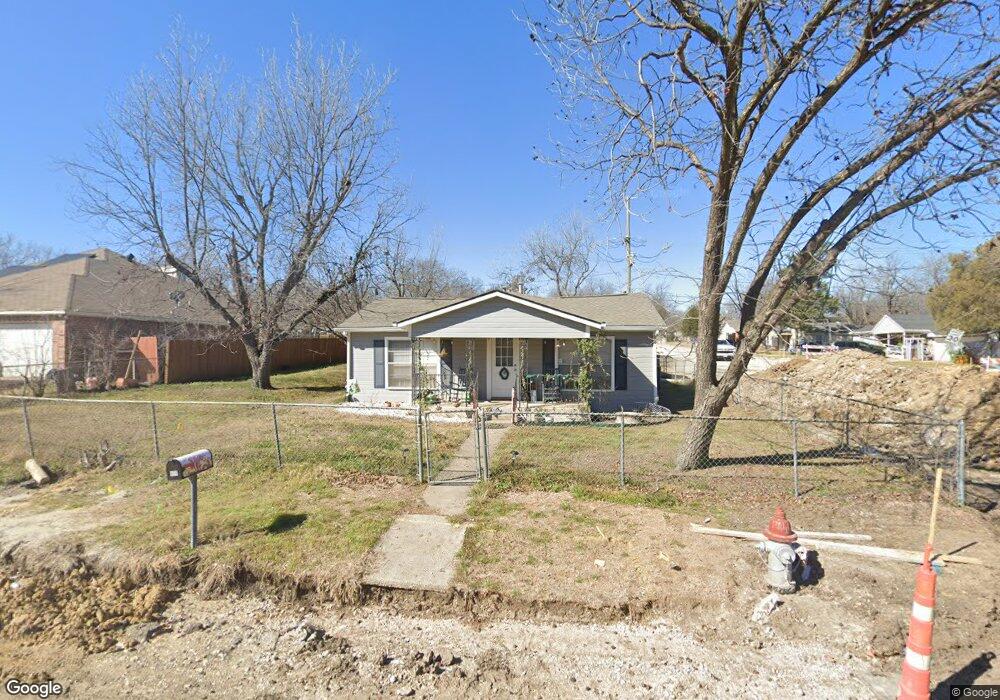
800 Kimbrough St Fort Worth, TX 76108
Estimated Value: $219,000 - $238,000
4
Beds
2
Baths
1,563
Sq Ft
$147/Sq Ft
Est. Value
About This Home
This home is located at 800 Kimbrough St, Fort Worth, TX 76108 and is currently estimated at $230,475, approximately $147 per square foot. 800 Kimbrough St is a home located in Tarrant County with nearby schools including Liberty Elementary School, Brewer Middle School, and Tannahill Intermediate School.
Ownership History
Date
Name
Owned For
Owner Type
Purchase Details
Closed on
Apr 14, 2020
Sold by
Upshaw Jami N
Bought by
Yanez Brittany
Current Estimated Value
Home Financials for this Owner
Home Financials are based on the most recent Mortgage that was taken out on this home.
Original Mortgage
$85,000
Outstanding Balance
$75,012
Interest Rate
3.2%
Mortgage Type
New Conventional
Estimated Equity
$155,463
Purchase Details
Closed on
Feb 6, 2012
Sold by
Longtide Properties Ltd
Bought by
Upshaw Jami N
Home Financials for this Owner
Home Financials are based on the most recent Mortgage that was taken out on this home.
Original Mortgage
$72,124
Interest Rate
4.4%
Mortgage Type
FHA
Purchase Details
Closed on
Jul 1, 2011
Sold by
Deutsche Bank National Trust Company
Bought by
Longtide Properties Ltd
Purchase Details
Closed on
Mar 3, 2011
Sold by
Miller Phillip
Bought by
Deutsche Bank National Trust Company
Create a Home Valuation Report for This Property
The Home Valuation Report is an in-depth analysis detailing your home's value as well as a comparison with similar homes in the area
Home Values in the Area
Average Home Value in this Area
Purchase History
| Date | Buyer | Sale Price | Title Company |
|---|---|---|---|
| Yanez Brittany | -- | Ort | |
| Upshaw Jami N | -- | Providence Title | |
| Longtide Properties Ltd | -- | Chicago Title | |
| Deutsche Bank National Trust Company | $27,475 | None Available |
Source: Public Records
Mortgage History
| Date | Status | Borrower | Loan Amount |
|---|---|---|---|
| Open | Yanez Brittany | $85,000 | |
| Previous Owner | Upshaw Jami N | $72,124 |
Source: Public Records
Tax History Compared to Growth
Tax History
| Year | Tax Paid | Tax Assessment Tax Assessment Total Assessment is a certain percentage of the fair market value that is determined by local assessors to be the total taxable value of land and additions on the property. | Land | Improvement |
|---|---|---|---|---|
| 2025 | $1,574 | $149,886 | $47,860 | $102,026 |
| 2024 | $1,574 | $149,886 | $47,860 | $102,026 |
| 2023 | $2,789 | $152,333 | $47,860 | $104,473 |
| 2022 | $2,888 | $106,654 | $25,000 | $81,654 |
| 2021 | $3,108 | $113,000 | $25,000 | $88,000 |
| 2020 | $3,048 | $110,000 | $25,000 | $85,000 |
| 2019 | $3,164 | $110,000 | $20,957 | $89,043 |
| 2018 | $2,968 | $103,170 | $12,000 | $91,170 |
| 2017 | $2,732 | $93,498 | $12,000 | $81,498 |
| 2016 | $2,754 | $94,246 | $12,000 | $82,246 |
| 2015 | $1,706 | $59,400 | $10,000 | $49,400 |
| 2014 | $1,706 | $59,400 | $10,000 | $49,400 |
Source: Public Records
Map
Nearby Homes
- 802 Kimbrough St
- 8101 Gibbs Dr
- 8100 Gibbs Dr
- 8105 Gibbs Dr
- 8100 Tinsley Ln
- 806 Kimbrough St
- 8107 Gibbs Dr
- 801 Kimbrough St
- 8104 Gibbs Dr
- 8104 Tinsley Ln
- 730 Kimbrough St
- 805 Kimbrough St
- 739 Kimbrough St
- 8109 Gibbs Dr
- 8108 Tinsley Ln
- 8108 Gibbs Dr
- 813 Kimbrough St
- 8112 Tinsley Ln
- 8110 Gibbs Dr
- 8113 Gibbs Dr