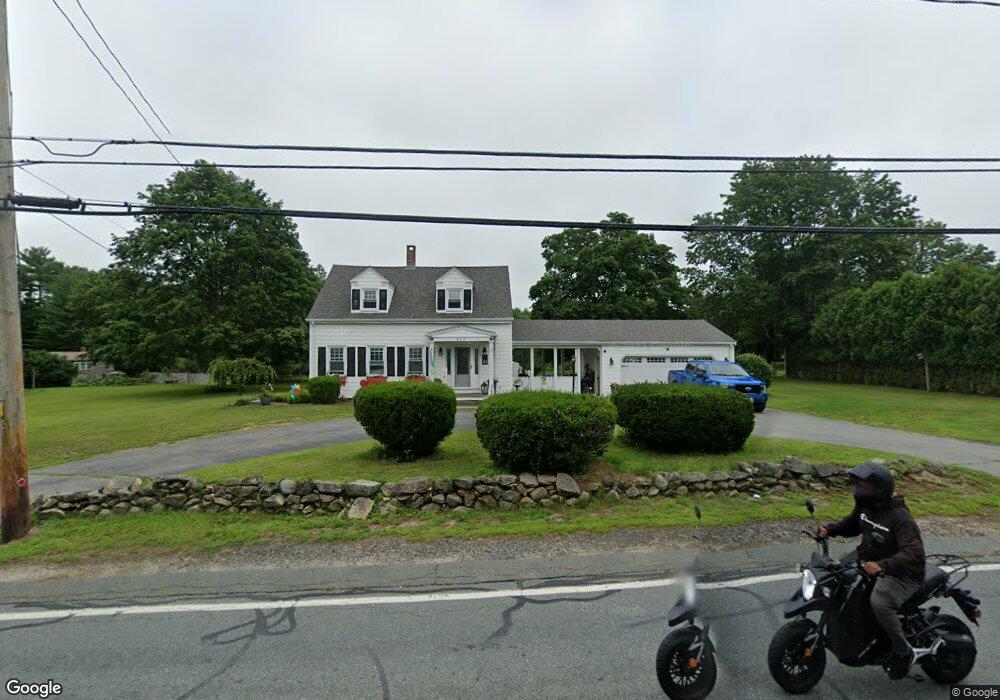
800 Main St Acushnet, MA 02743
Upper Acushnet NeighborhoodEstimated Value: $583,887 - $700,000
3
Beds
1
Bath
1,724
Sq Ft
$366/Sq Ft
Est. Value
About This Home
This home is located at 800 Main St, Acushnet, MA 02743 and is currently estimated at $631,722, approximately $366 per square foot. 800 Main St is a home located in Bristol County with nearby schools including Acushnet Elementary School, Albert F Ford Middle School, and St Francis Xavier Elementary School.
Ownership History
Date
Name
Owned For
Owner Type
Purchase Details
Closed on
Dec 8, 2020
Sold by
Larson Catherine J and Larson Paul R
Bought by
Larson Paul R and Larson Catherine J
Current Estimated Value
Purchase Details
Closed on
Feb 18, 1994
Sold by
Fnma
Bought by
Larson Paul R and Larson Catherine J
Home Financials for this Owner
Home Financials are based on the most recent Mortgage that was taken out on this home.
Original Mortgage
$91,500
Interest Rate
7.18%
Mortgage Type
Purchase Money Mortgage
Purchase Details
Closed on
Nov 9, 1989
Sold by
Est Leite Ernest
Bought by
Hutchings Garry A
Home Financials for this Owner
Home Financials are based on the most recent Mortgage that was taken out on this home.
Original Mortgage
$148,000
Interest Rate
10.03%
Mortgage Type
Purchase Money Mortgage
Create a Home Valuation Report for This Property
The Home Valuation Report is an in-depth analysis detailing your home's value as well as a comparison with similar homes in the area
Home Values in the Area
Average Home Value in this Area
Purchase History
| Date | Buyer | Sale Price | Title Company |
|---|---|---|---|
| Larson Paul R | -- | None Available | |
| Larson Paul R | $111,500 | -- | |
| Federal National Mortgage Association | $108,000 | -- | |
| Hutchings Garry A | $165,000 | -- |
Source: Public Records
Mortgage History
| Date | Status | Borrower | Loan Amount |
|---|---|---|---|
| Previous Owner | Hutchings Garry A | $60,000 | |
| Previous Owner | Hutchings Garry A | $91,500 | |
| Previous Owner | Hutchings Garry A | $148,000 |
Source: Public Records
Tax History
| Year | Tax Paid | Tax Assessment Tax Assessment Total Assessment is a certain percentage of the fair market value that is determined by local assessors to be the total taxable value of land and additions on the property. | Land | Improvement |
|---|---|---|---|---|
| 2025 | $52 | $480,300 | $178,500 | $301,800 |
| 2024 | $5,019 | $439,900 | $169,100 | $270,800 |
| 2023 | $5,044 | $420,300 | $153,500 | $266,800 |
| 2022 | $5,052 | $380,700 | $144,500 | $236,200 |
| 2021 | $4,807 | $347,600 | $144,500 | $203,100 |
| 2020 | $4,720 | $338,600 | $135,500 | $203,100 |
| 2019 | $4,525 | $319,100 | $129,500 | $189,600 |
| 2018 | $4,392 | $304,600 | $129,500 | $175,100 |
| 2017 | $2,670 | $296,600 | $129,500 | $167,100 |
| 2016 | $4,313 | $296,800 | $129,500 | $167,300 |
| 2015 | $4,020 | $281,500 | $129,500 | $152,000 |
Source: Public Records
Map
Nearby Homes
- 0 Land Way Unit 73479153
- 489 Main St
- 363 Main St
- 0 Keene Rd Unit 73459818
- 329 Middle Rd
- 25 Pershing Ave
- 23 Oliveira Ave
- 191 Hathaway Rd
- 134 Nyes Ln
- 7 Hamlin St
- 199 Quaker Ln
- 168 Keene Rd
- 0 Hathaway Rd Unit 73469544
- 12 White St
- 1015 Forbes St
- 973 Pembroke St
- 23 Coury Dr
- 40 Foley Dr
- ES Acushnet Ave
- SS Charbonneau Ln
Your Personal Tour Guide
Ask me questions while you tour the home.