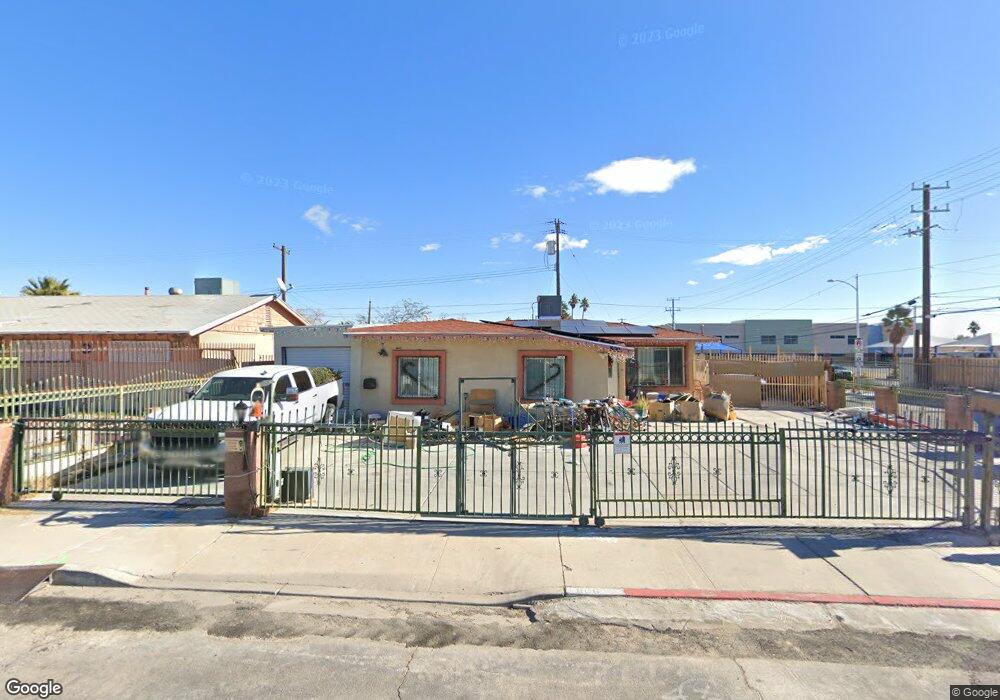
800 N 18th St Las Vegas, NV 89101
Downtown Las Vegas NeighborhoodEstimated Value: $201,000 - $362,000
3
Beds
2
Baths
1,503
Sq Ft
$203/Sq Ft
Est. Value
About This Home
This home is located at 800 N 18th St, Las Vegas, NV 89101 and is currently estimated at $304,828, approximately $202 per square foot. 800 N 18th St is a home located in Clark County with nearby schools including Halle Hewetson Elementary School, J.D. Smith Middle School, and Rancho High School.
Ownership History
Date
Name
Owned For
Owner Type
Purchase Details
Closed on
Oct 30, 2019
Sold by
Lewis Marcia May
Bought by
Corona Enrique Marti and Carrera Claudia Heredia
Current Estimated Value
Purchase Details
Closed on
Nov 4, 2009
Sold by
Hsbc Bank Usa Na
Bought by
Lewis Dennis J
Purchase Details
Closed on
Jul 16, 2009
Sold by
Vivanco Luis
Bought by
Hsbc Bank Usa Na
Purchase Details
Closed on
Dec 11, 2006
Sold by
Rincon Antonio and Rincon Tomasa
Bought by
Vivanco Luis
Home Financials for this Owner
Home Financials are based on the most recent Mortgage that was taken out on this home.
Original Mortgage
$172,000
Interest Rate
7.65%
Mortgage Type
Unknown
Purchase Details
Closed on
Dec 16, 1998
Sold by
Thompson Lewis L and Thompson Linda L
Bought by
Rincon Antonio and Rincon Tomasa
Home Financials for this Owner
Home Financials are based on the most recent Mortgage that was taken out on this home.
Original Mortgage
$90,849
Interest Rate
6.63%
Mortgage Type
FHA
Create a Home Valuation Report for This Property
The Home Valuation Report is an in-depth analysis detailing your home's value as well as a comparison with similar homes in the area
Home Values in the Area
Average Home Value in this Area
Purchase History
| Date | Buyer | Sale Price | Title Company |
|---|---|---|---|
| Corona Enrique Marti | $110,250 | Ticor Title Las Vegas Sum | |
| Lewis Dennis J | $45,199 | Silver State Title Company | |
| Hsbc Bank Usa Na | $50,220 | None Available | |
| Vivanco Luis | $210,000 | Great American Title | |
| Rincon Antonio | $91,000 | Old Republic Title Company |
Source: Public Records
Mortgage History
| Date | Status | Borrower | Loan Amount |
|---|---|---|---|
| Previous Owner | Vivanco Luis | $172,000 | |
| Previous Owner | Rincon Antonio | $90,849 |
Source: Public Records
Tax History Compared to Growth
Tax History
| Year | Tax Paid | Tax Assessment Tax Assessment Total Assessment is a certain percentage of the fair market value that is determined by local assessors to be the total taxable value of land and additions on the property. | Land | Improvement |
|---|---|---|---|---|
| 2025 | $829 | $44,575 | $25,900 | $18,675 |
| 2024 | $768 | $44,575 | $25,900 | $18,675 |
| 2023 | $768 | $45,880 | $29,050 | $16,830 |
| 2022 | $712 | $38,448 | $23,450 | $14,998 |
| 2021 | $659 | $31,479 | $17,500 | $13,979 |
| 2020 | $609 | $29,339 | $15,750 | $13,589 |
| 2019 | $571 | $27,111 | $14,000 | $13,111 |
| 2018 | $545 | $25,213 | $12,950 | $12,263 |
| 2017 | $511 | $22,649 | $10,500 | $12,149 |
| 2016 | $511 | $19,817 | $8,050 | $11,767 |
| 2015 | $509 | $17,011 | $5,600 | $11,411 |
| 2014 | $493 | $14,591 | $4,200 | $10,391 |
Source: Public Records
Map
Nearby Homes
- 1705 Leslie Ave Unit 1
- 833 N Bruce St
- 828 Held Rd
- 1812 Ryan Ave
- 624 N Bruce St
- 709 N 22nd St
- 629 N 16th St
- 700 N 14th St
- 2020 E Bonanza Rd
- 2005 Jansen Ave
- 921 Delta St
- 1908 Linden Ave
- 2016 Linden Ave
- 507 N 15th St
- 437 N 23rd St
- 920 E Bonanza Rd
- 1915 E Mesquite Ave
- 513 N 13th Bldg A St
- 513 N 13th St
- 416 N 15th St