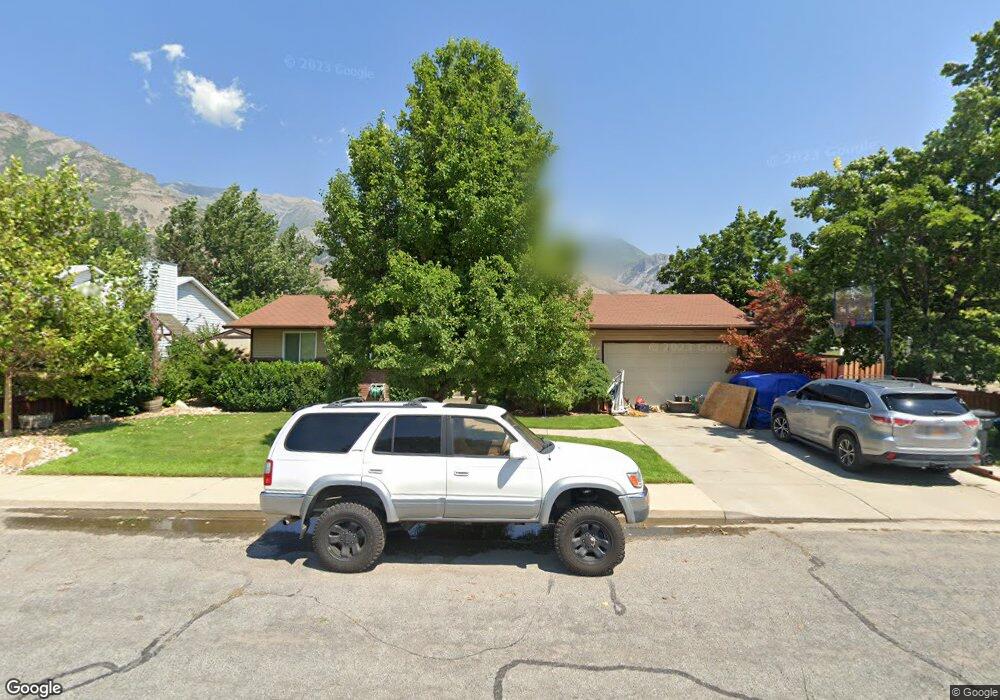
800 N 535 E Pleasant Grove, UT 84062
Estimated Value: $457,000 - $533,926
4
Beds
1
Bath
2,144
Sq Ft
$230/Sq Ft
Est. Value
About This Home
This home is located at 800 N 535 E, Pleasant Grove, UT 84062 and is currently estimated at $492,482, approximately $229 per square foot. 800 N 535 E is a home located in Utah County with nearby schools including Grovecrest Elementary School, Pleasant Grove Junior High School, and Pleasant Grove High School.
Ownership History
Date
Name
Owned For
Owner Type
Purchase Details
Closed on
Mar 27, 2003
Sold by
Edwards Lee
Bought by
Edwards Lee and Edwards Wendy
Current Estimated Value
Home Financials for this Owner
Home Financials are based on the most recent Mortgage that was taken out on this home.
Original Mortgage
$7,000
Outstanding Balance
$3,016
Interest Rate
5.79%
Estimated Equity
$489,466
Purchase Details
Closed on
Mar 26, 2003
Sold by
Hendricks Sean J and Hendricks Paula R
Bought by
Edwards Lee
Home Financials for this Owner
Home Financials are based on the most recent Mortgage that was taken out on this home.
Original Mortgage
$7,000
Outstanding Balance
$3,016
Interest Rate
5.79%
Estimated Equity
$489,466
Purchase Details
Closed on
Oct 23, 1998
Sold by
Mather Eric G and Mather Rose M
Bought by
Hendricks Sean J and Hendricks Paula R
Home Financials for this Owner
Home Financials are based on the most recent Mortgage that was taken out on this home.
Original Mortgage
$118,150
Interest Rate
6.71%
Create a Home Valuation Report for This Property
The Home Valuation Report is an in-depth analysis detailing your home's value as well as a comparison with similar homes in the area
Home Values in the Area
Average Home Value in this Area
Purchase History
We collect this data history from publicly available records. To have your information removed, we recommend requesting removal directly through your county’s website.
| Date | Buyer | Sale Price | Title Company |
|---|---|---|---|
| Edwards Lee | -- | Access Title Company | |
| Edwards Lee | -- | Old Republic Title Of Utah | |
| Hendricks Sean J | -- | -- |
Source: Public Records
Mortgage History
We collect this data history from publicly available records. To have your information removed, we recommend requesting removal directly through your county’s website.
| Date | Status | Borrower | Loan Amount |
|---|---|---|---|
| Open | Edwards Lee | $7,000 | |
| Previous Owner | Hendricks Sean J | $118,150 |
Source: Public Records
Tax History
| Year | Tax Paid | Tax Assessment Tax Assessment Total Assessment is a certain percentage of the fair market value that is determined by local assessors to be the total taxable value of land and additions on the property. | Land | Improvement |
|---|---|---|---|---|
| 2025 | $1,891 | $246,510 | -- | -- |
| 2024 | $1,891 | $225,665 | $0 | $0 |
| 2023 | $1,859 | $227,095 | $0 | $0 |
| 2022 | $2,008 | $244,145 | $0 | $0 |
| 2021 | $1,732 | $320,600 | $156,600 | $164,000 |
| 2020 | $1,592 | $288,900 | $139,800 | $149,100 |
| 2019 | $1,436 | $269,400 | $128,500 | $140,900 |
| 2018 | $1,366 | $242,300 | $117,100 | $125,200 |
| 2017 | $1,206 | $113,905 | $0 | $0 |
| 2016 | $1,169 | $106,590 | $0 | $0 |
| 2015 | $1,225 | $105,820 | $0 | $0 |
| 2014 | $1,131 | $96,745 | $0 | $0 |
Source: Public Records
Map
Nearby Homes
Your Personal Tour Guide
Ask me questions while you tour the home.