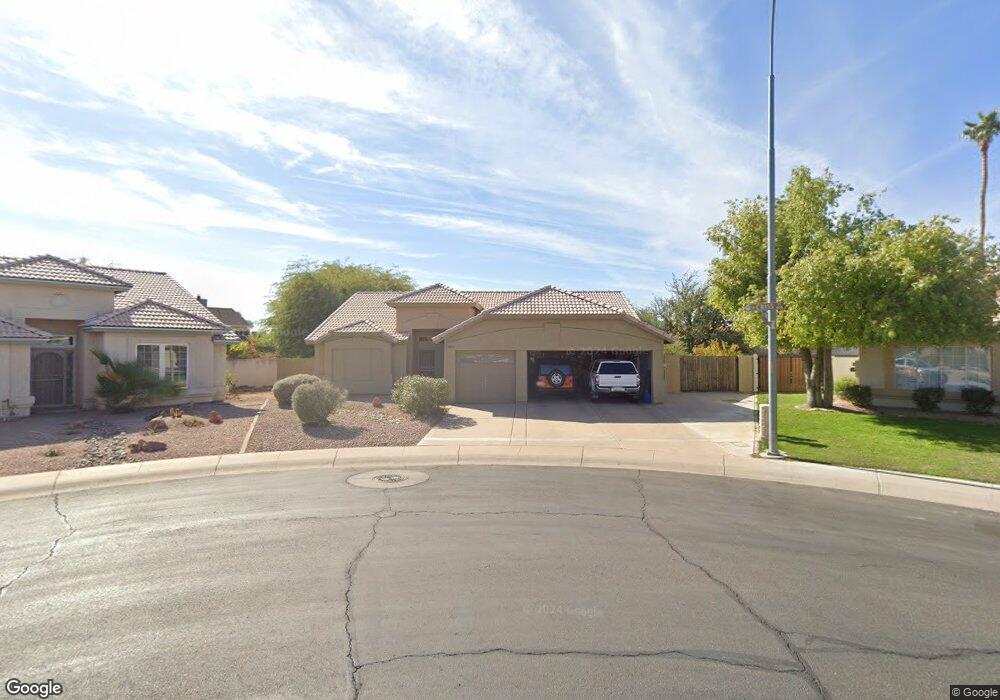
800 N Criss St Chandler, AZ 85226
West Chandler NeighborhoodEstimated Value: $561,541 - $667,000
3
Beds
2
Baths
1,924
Sq Ft
$325/Sq Ft
Est. Value
About This Home
This home is located at 800 N Criss St, Chandler, AZ 85226 and is currently estimated at $625,385, approximately $325 per square foot. 800 N Criss St is a home located in Maricopa County with nearby schools including Kyrene Traditional Academy, Kyrene Aprende Middle School, and Corona Del Sol High School.
Ownership History
Date
Name
Owned For
Owner Type
Purchase Details
Closed on
Feb 26, 2001
Sold by
Thompson Bret D and Thompson Pamela J
Bought by
Moser James D
Current Estimated Value
Home Financials for this Owner
Home Financials are based on the most recent Mortgage that was taken out on this home.
Original Mortgage
$197,100
Outstanding Balance
$69,765
Interest Rate
6.98%
Mortgage Type
New Conventional
Estimated Equity
$555,620
Purchase Details
Closed on
Jun 20, 1996
Sold by
Quandt Luvern E and Quandt Audre L
Bought by
Thompson Bret D and Thompson Pamela J
Home Financials for this Owner
Home Financials are based on the most recent Mortgage that was taken out on this home.
Original Mortgage
$110,000
Interest Rate
8.09%
Mortgage Type
New Conventional
Create a Home Valuation Report for This Property
The Home Valuation Report is an in-depth analysis detailing your home's value as well as a comparison with similar homes in the area
Home Values in the Area
Average Home Value in this Area
Purchase History
| Date | Buyer | Sale Price | Title Company |
|---|---|---|---|
| Moser James D | $207,500 | Security Title Agency | |
| Thompson Bret D | $155,000 | Fiesta Title & Escrow Agency |
Source: Public Records
Mortgage History
| Date | Status | Borrower | Loan Amount |
|---|---|---|---|
| Open | Moser James D | $197,100 | |
| Previous Owner | Thompson Bret D | $110,000 |
Source: Public Records
Tax History Compared to Growth
Tax History
| Year | Tax Paid | Tax Assessment Tax Assessment Total Assessment is a certain percentage of the fair market value that is determined by local assessors to be the total taxable value of land and additions on the property. | Land | Improvement |
|---|---|---|---|---|
| 2025 | $2,440 | $30,629 | -- | -- |
| 2024 | $2,334 | $29,170 | -- | -- |
| 2023 | $2,334 | $45,180 | $9,030 | $36,150 |
| 2022 | $2,221 | $34,180 | $6,830 | $27,350 |
| 2021 | $2,342 | $33,230 | $6,640 | $26,590 |
| 2020 | $2,289 | $31,930 | $6,380 | $25,550 |
| 2019 | $2,222 | $29,520 | $5,900 | $23,620 |
| 2018 | $2,149 | $27,860 | $5,570 | $22,290 |
| 2017 | $2,048 | $27,020 | $5,400 | $21,620 |
| 2016 | $2,090 | $26,310 | $5,260 | $21,050 |
| 2015 | $1,929 | $24,980 | $4,990 | $19,990 |
Source: Public Records
Map
Nearby Homes
- 3833 W Ivanhoe St
- 3930 W Monterey St Unit 108
- 3580 W Dublin St
- 527 N Pepperwood Ct Unit 3
- 526 N Criss St
- 802 N Butte Ave
- 782 N Sicily Dr
- 4174 W Harrison St
- 3947 W Roundabout Cir
- 3382 W Monterey St
- 3683 W Barcelona Dr
- 3513 W Carla Vista Dr
- 991 N Florence Dr
- 3424 W Thude Dr
- 3522 W Detroit St
- 390 N Enterprise Place Unit B37
- 390 N Enterprise Place Unit A6
- 1739 E Knox Rd
- 3165 W Golden Ln
- 3111 W Baylor Ln
- 3781 W Linda Ln
- 801 N Los Feliz Dr
- 810 N Criss St
- 3801 W Golden Keys Way
- 3730 W Ivanhoe St
- 3726 W Ivanhoe St
- 3734 W Ivanhoe St
- 3722 W Ivanhoe St
- 3771 W Linda Ln
- 820 N Criss St
- 3810 W Ivanhoe St Unit SHARP+
- 3810 W Ivanhoe St
- 821 N Los Feliz Dr
- 3718 W Ivanhoe St
- 3772 W Linda Ln
- 3814 W Ivanhoe St
- 3811 W Golden Keys Way
- 3810 W Golden Keys Way
- 3714 W Ivanhoe St
- 3761 W Linda Ln