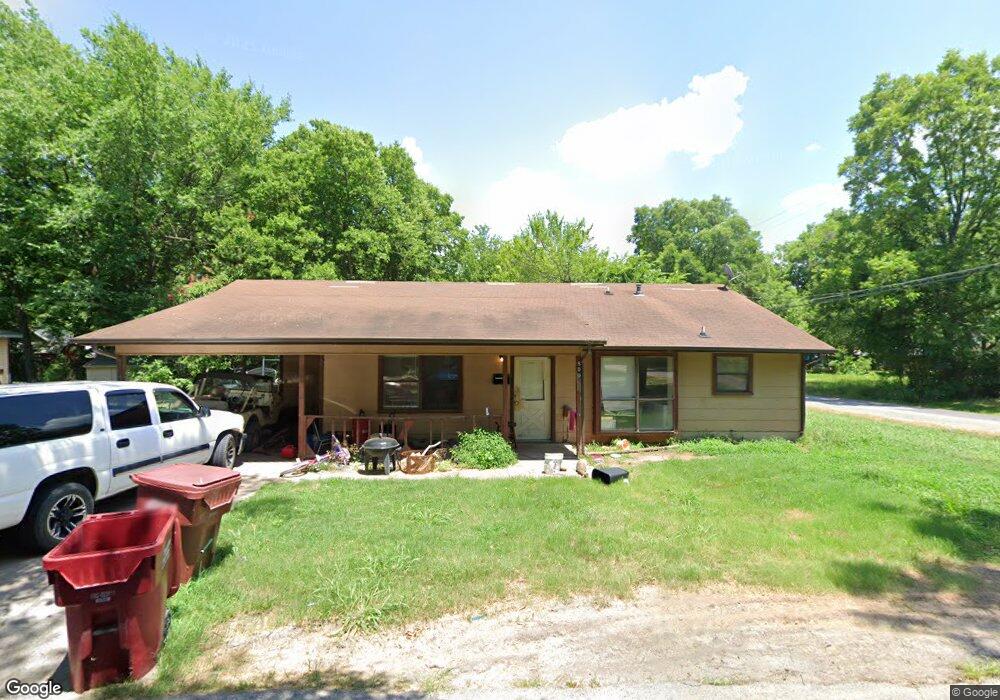
800 Pine St Bonham, TX 75418
Estimated Value: $152,866 - $198,000
Studio
--
Bath
1,340
Sq Ft
$134/Sq Ft
Est. Value
About This Home
This home is located at 800 Pine St, Bonham, TX 75418 and is currently estimated at $179,467, approximately $133 per square foot. 800 Pine St is a home located in Fannin County with nearby schools including Evans Elementary School, Finley-Oates Elementary School, and LH Rather Jr High School.
Ownership History
Date
Name
Owned For
Owner Type
Purchase Details
Closed on
May 13, 2022
Sold by
Reagan Living Trust
Bought by
Miller Edward J
Current Estimated Value
Home Financials for this Owner
Home Financials are based on the most recent Mortgage that was taken out on this home.
Original Mortgage
$110,000
Outstanding Balance
$89,664
Interest Rate
3.83%
Mortgage Type
Seller Take Back
Estimated Equity
$89,803
Purchase Details
Closed on
May 12, 2022
Sold by
Reagan Living Trust
Bought by
Miller Edward J
Home Financials for this Owner
Home Financials are based on the most recent Mortgage that was taken out on this home.
Original Mortgage
$110,000
Outstanding Balance
$89,664
Interest Rate
3.83%
Mortgage Type
Seller Take Back
Estimated Equity
$89,803
Create a Home Valuation Report for This Property
The Home Valuation Report is an in-depth analysis detailing your home's value as well as a comparison with similar homes in the area
Purchase History
| Date | Buyer | Sale Price | Title Company |
|---|---|---|---|
| Miller Edward J | -- | Main Street Title | |
| Miller Edward J | -- | Main Street Title |
Source: Public Records
Mortgage History
| Date | Status | Borrower | Loan Amount |
|---|---|---|---|
| Open | Miller Edward J | $110,000 |
Source: Public Records
Tax History
| Year | Tax Paid | Tax Assessment Tax Assessment Total Assessment is a certain percentage of the fair market value that is determined by local assessors to be the total taxable value of land and additions on the property. | Land | Improvement |
|---|---|---|---|---|
| 2025 | $2,317 | $119,450 | $35,720 | $83,730 |
| 2024 | $2,277 | $117,380 | $35,540 | $81,840 |
| 2023 | $2,076 | $105,300 | $22,740 | $82,560 |
| 2022 | $2,173 | $98,790 | $16,780 | $82,010 |
| 2021 | $1,897 | $75,060 | $8,650 | $66,410 |
| 2020 | $1,756 | $68,690 | $6,080 | $62,610 |
| 2019 | $1,894 | $71,280 | $5,960 | $65,320 |
| 2018 | $1,579 | $59,480 | $5,900 | $53,580 |
| 2017 | $1,254 | $49,070 | $3,100 | $45,970 |
| 2016 | $1,083 | $42,360 | $3,100 | $39,260 |
| 2015 | -- | $30,480 | $2,980 | $27,500 |
| 2014 | -- | $30,410 | $2,440 | $27,970 |
Source: Public Records
Map
Nearby Homes
Your Personal Tour Guide
Ask me questions while you tour the home.