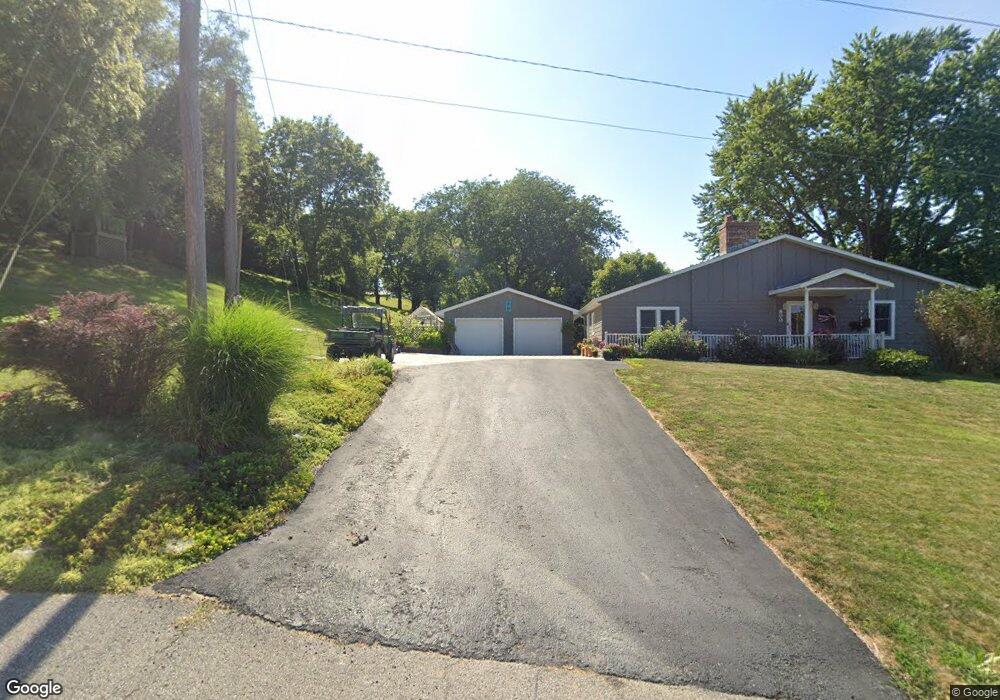
800 S Bluff St Rock Port, MO 64482
Estimated Value: $136,000 - $225,000
--
Bed
--
Bath
1,536
Sq Ft
$121/Sq Ft
Est. Value
About This Home
This home is located at 800 S Bluff St, Rock Port, MO 64482 and is currently estimated at $185,359, approximately $120 per square foot. 800 S Bluff St is a home with nearby schools including Rock Port Elementary School and Rock Port High School.
Ownership History
Date
Name
Owned For
Owner Type
Purchase Details
Closed on
Mar 18, 2014
Sold by
Herron Kelley and Herron Amy
Bought by
Herron Kelley and Herron Amy
Current Estimated Value
Purchase Details
Closed on
Jul 21, 2011
Sold by
Herron Kelley and Herron Amy
Bought by
Herron
Purchase Details
Closed on
Mar 23, 2010
Sold by
Esser Jeff S and Esser Lisa L
Bought by
Herron Kelley and Herron Amy
Purchase Details
Closed on
Aug 30, 2007
Sold by
Cook Joel M and Cook Melissa S
Bought by
Esser Jeff S and Esser Lisa L
Purchase Details
Closed on
Mar 28, 2003
Sold by
Jones Violet
Bought by
Cook Joel M and Cook Melissa S
Create a Home Valuation Report for This Property
The Home Valuation Report is an in-depth analysis detailing your home's value as well as a comparison with similar homes in the area
Home Values in the Area
Average Home Value in this Area
Purchase History
| Date | Buyer | Sale Price | Title Company |
|---|---|---|---|
| Herron Kelley | -- | -- | |
| Herron | -- | -- | |
| Herron Kelley | $125,500 | -- | |
| Esser Jeff S | -- | -- | |
| Cook Joel M | $75,000 | -- |
Source: Public Records
Tax History Compared to Growth
Tax History
| Year | Tax Paid | Tax Assessment Tax Assessment Total Assessment is a certain percentage of the fair market value that is determined by local assessors to be the total taxable value of land and additions on the property. | Land | Improvement |
|---|---|---|---|---|
| 2024 | $2,183 | $26,239 | $6,061 | $20,178 |
| 2023 | $2,181 | $26,239 | $6,061 | $20,178 |
| 2022 | $198,421 | $125,500 | $5,510 | $18,335 |
| 2021 | $1,816 | $23,845 | $5,510 | $18,335 |
| 2020 | $1,816 | $21,679 | $0 | $21,679 |
| 2019 | $1,815 | $21,679 | $0 | $21,679 |
| 2018 | -- | $21,679 | $5,016 | $16,663 |
| 2017 | -- | $21,679 | $5,016 | $16,663 |
| 2016 | -- | $21,679 | $5,016 | $16,663 |
| 2015 | -- | $21,679 | $5,016 | $16,663 |
| 2012 | -- | $17,176 | $0 | $0 |
Source: Public Records
Map
Nearby Homes
- 602 Snowden Dr
- 708 S Bluff St
- 604 Snowden Dr
- 801 S Bluff St
- 603 Snowden Dr
- 506 William St
- 706 S Bluff St
- 605 Snowden Dr
- 504 William St
- 606 Snowden Dr
- 502 William St
- 505 William St
- 704 S Bluff St
- 503 William St
- 702 S Bluff St
- 500 William St
- 700 Underwood Dr
- 408 Charles St
- 501 William St
- 701 Underwood Dr